
 Russian
  中文
中文  English
  Bahasa Indonesia
 Strategy - Awesome Oscillator
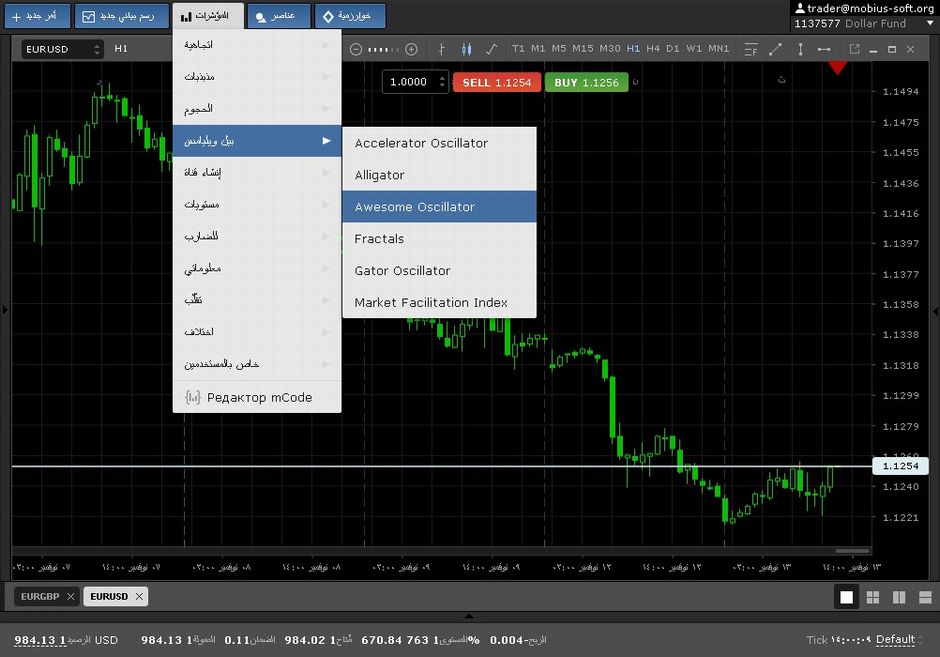
For installation of Awesome Oscillator on the chart, let's click the button Indicators at a toolbar and in the appeared menu you should choose Bill Williams - Awesome Oscillator.
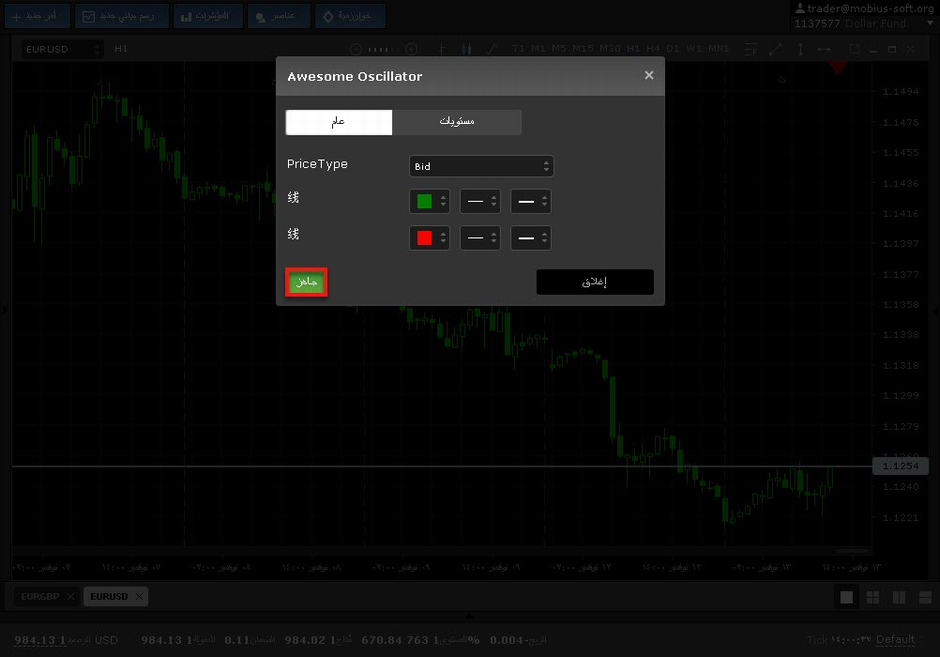
We won’t change the settings.
(Awesome Oscillator of Bill Williams - is the second measurement of the market. It determines a driving force of the market which is also called the second measurement, by 5 last bars, comparing them to a driving force on the last 34 bars.
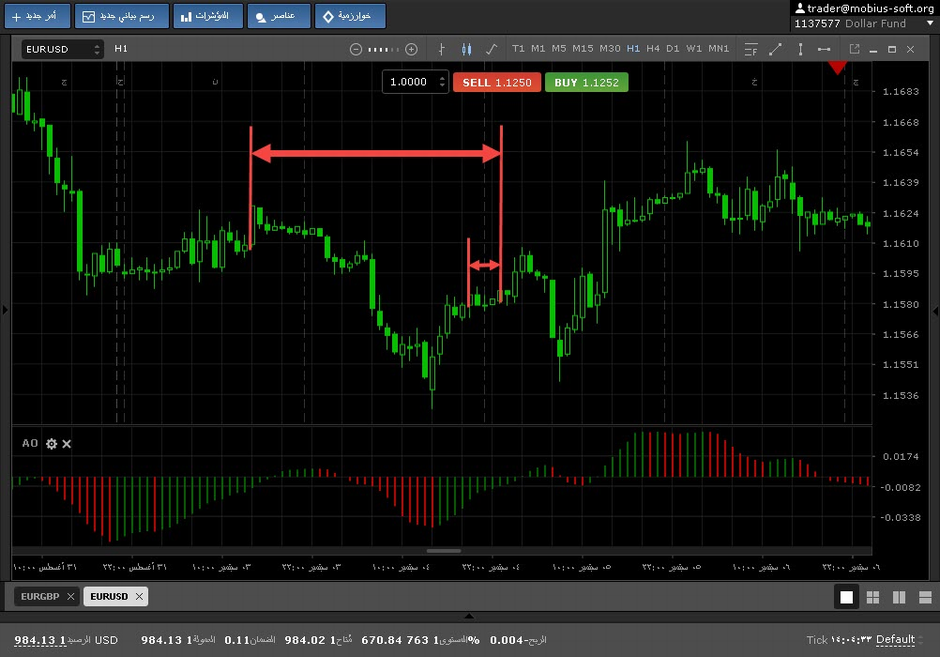
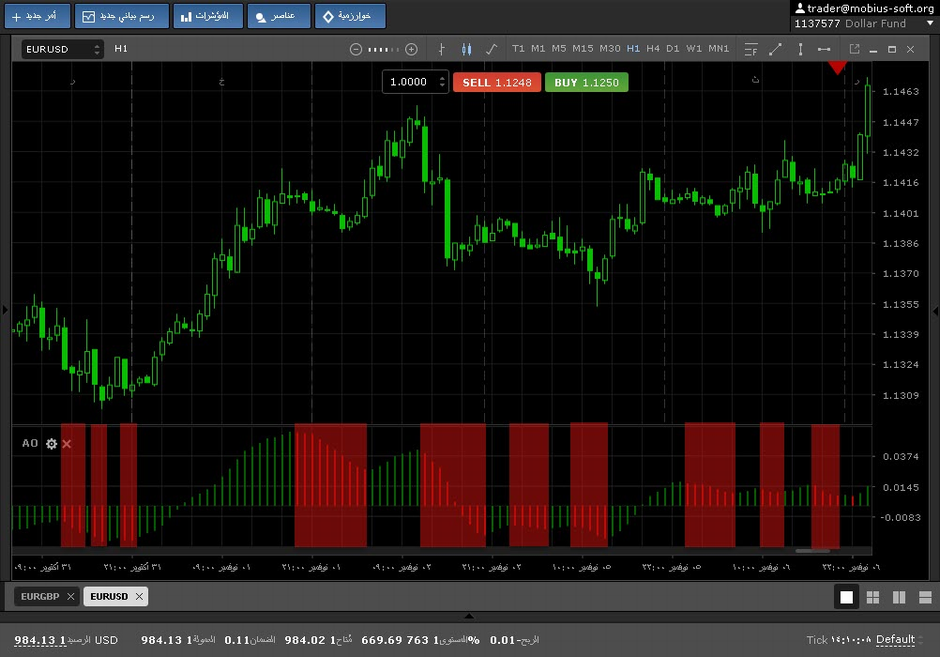
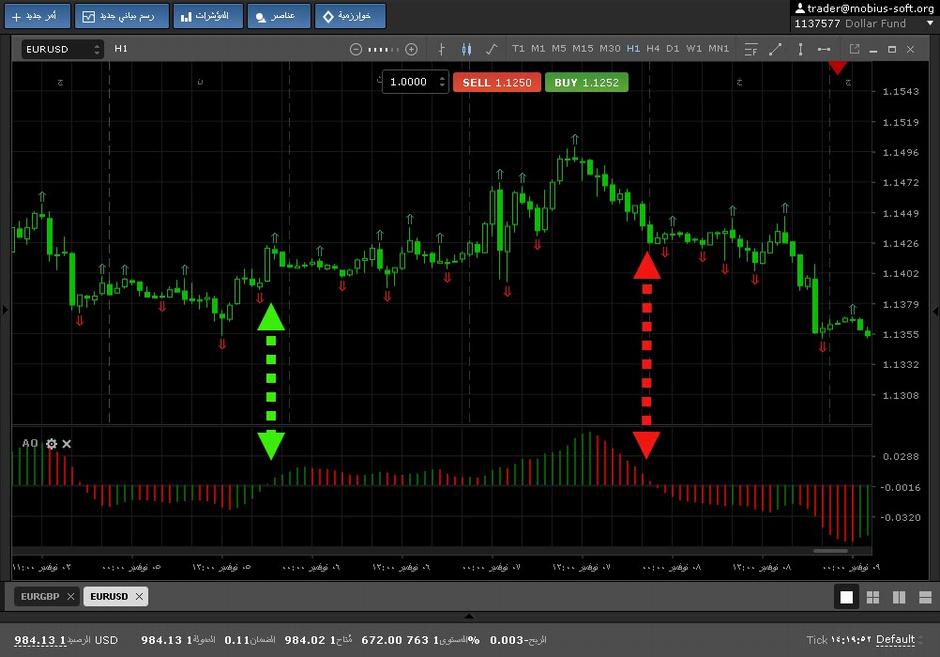
As we see, on chart the indicator is presented in the histogram form
Each column which is higher than previous is green,
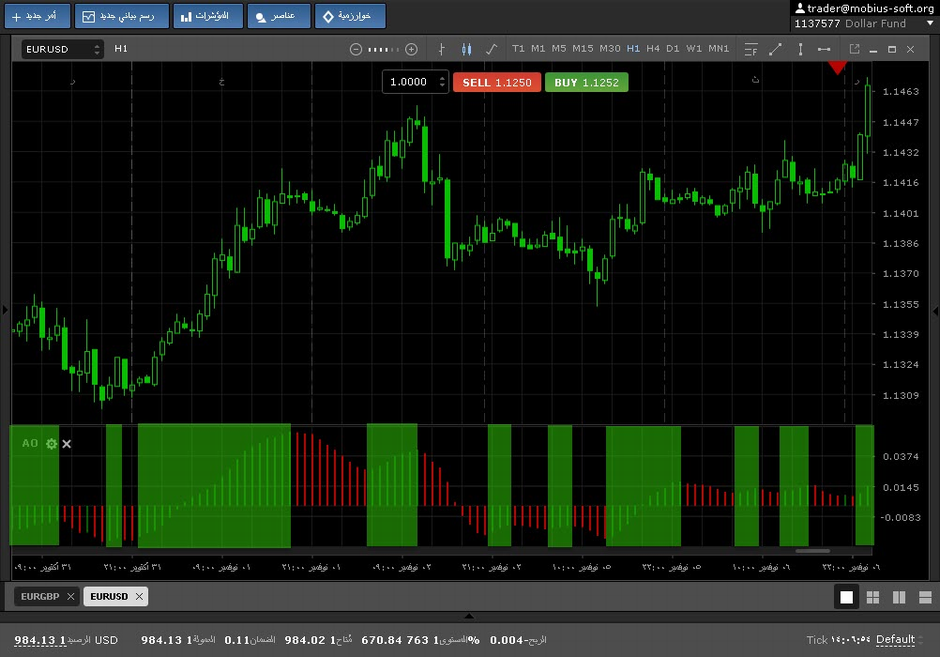
and red - is each column which is lower than previous.
Awesome Oscillator creates three signals on buy and three signals on sell,
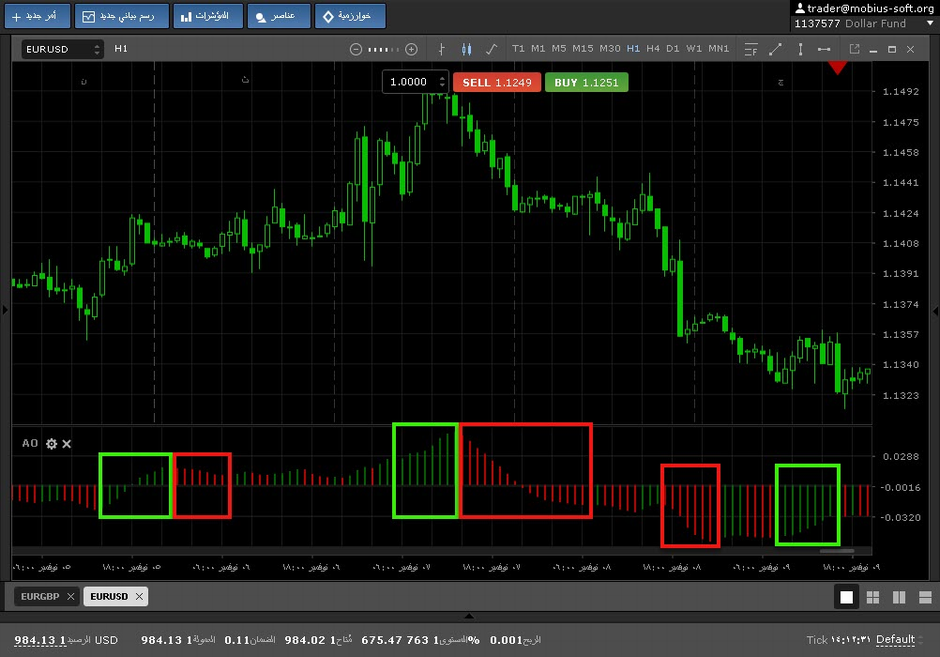
which cannot be used until, there will be no first filled fractal outside the Alligator mouth.
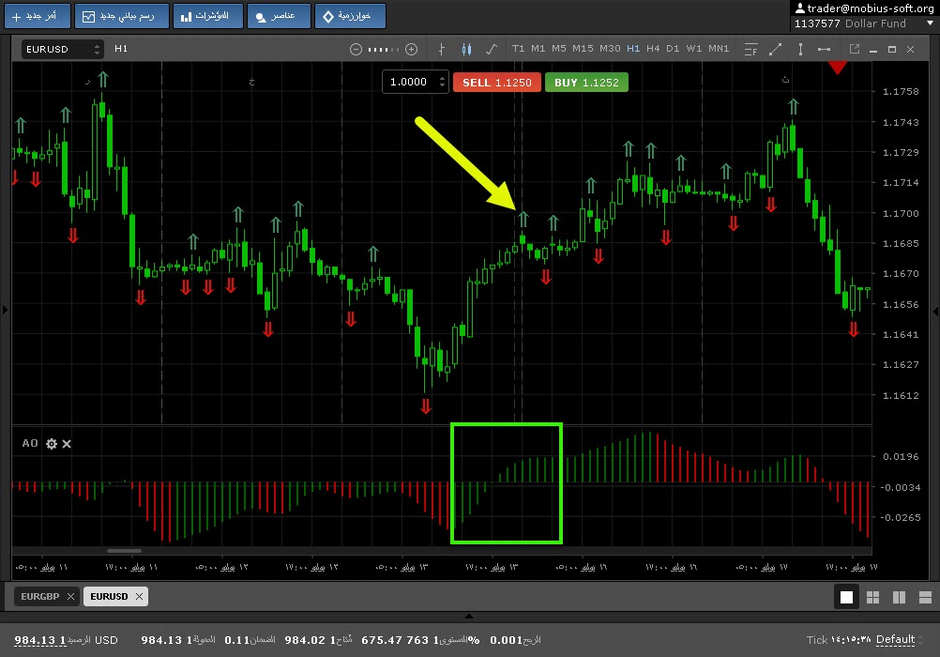
Also, the oscillator can give a signal on buy which is called "saucer". The signal arises when the histogram, located above the zero line changes the direction with descending on ascending.
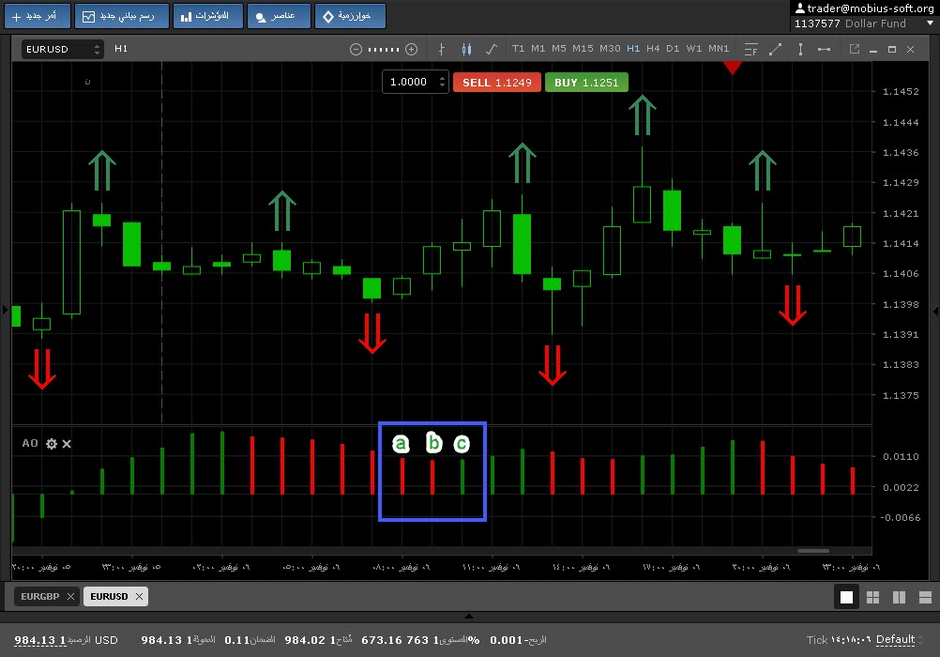
The column "A" shall be above a column "B" and can be of any color. The column "B" shall be red. The column "S" (signal) shall be green. The signal bar - the bar on which the signal column was formed.
The rule works for all types of signals: we buy only if the current column green, and we sell only if the current column is red.
We wish you good profit and great success in trade.
It is possible to discuss this strategy at forum