Indicator Momentum
We are glad to present you the indicator called Momentum which task is to compare current price of closing with the last price, for a certain period.
It is placed in the section "Oscillators"
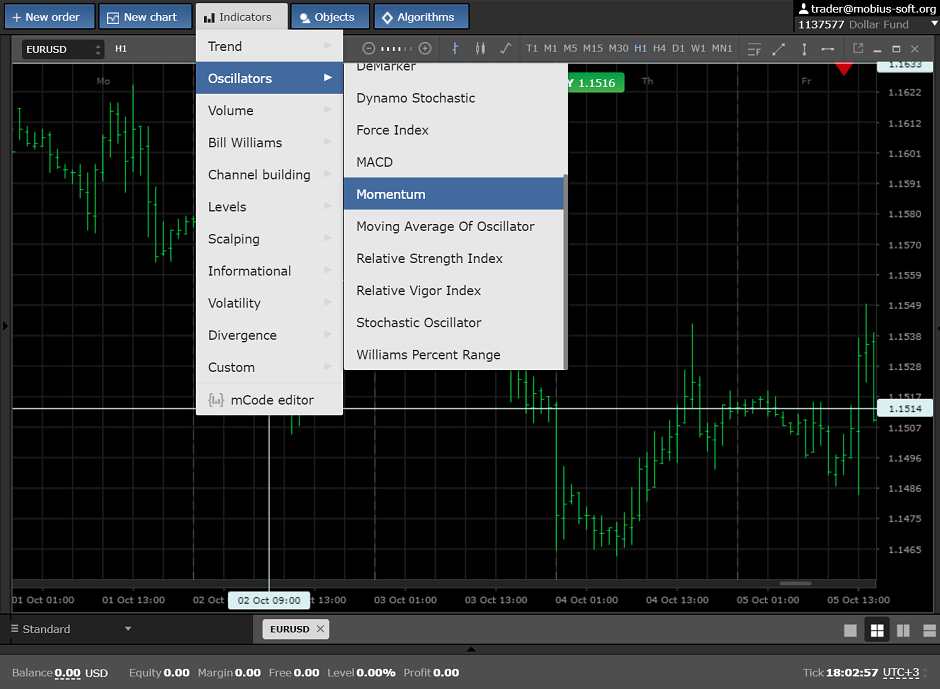
and it looks as follows:
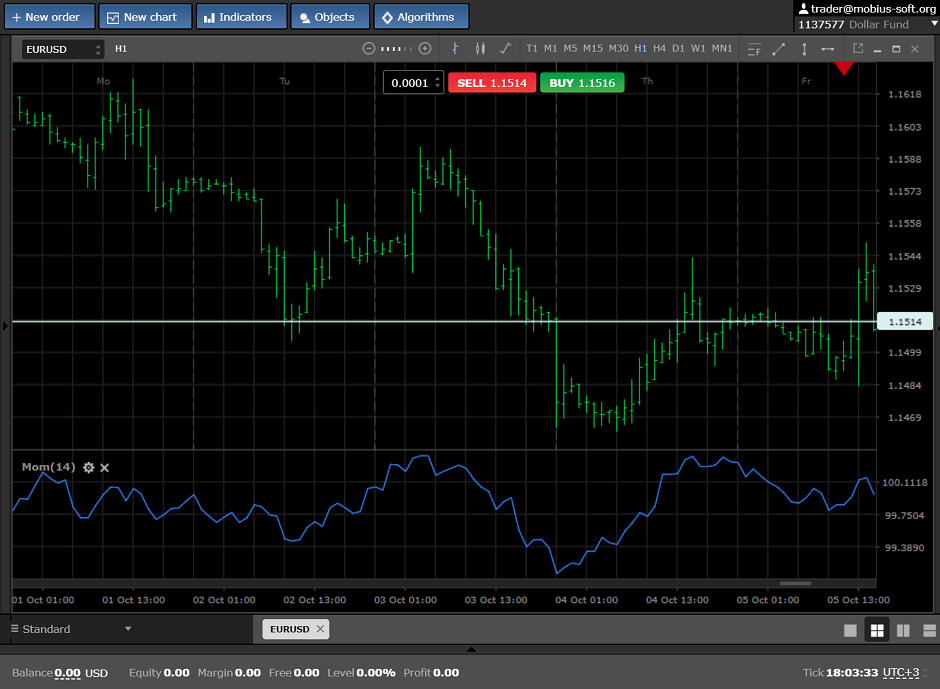
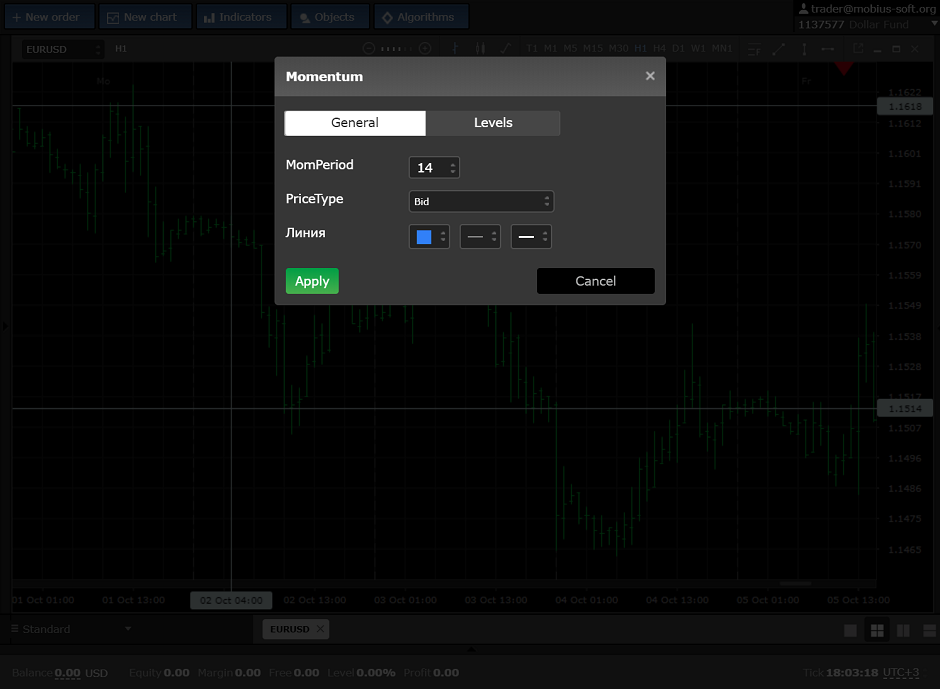
initially there are standard settings but they can be changed, as the period, and visualization (color and width of the line).
The Momentum indicator is good in fact that it it is possible to work out perfectly the divergence, as shown at the pic below:
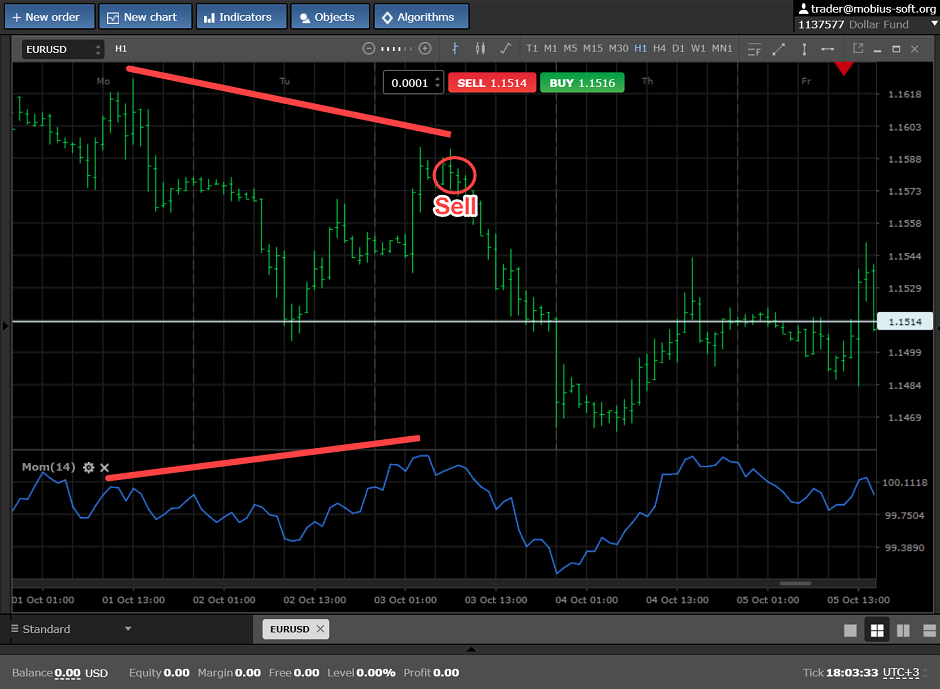
We open the transaction on Buy when the line rises higher than the level 100,
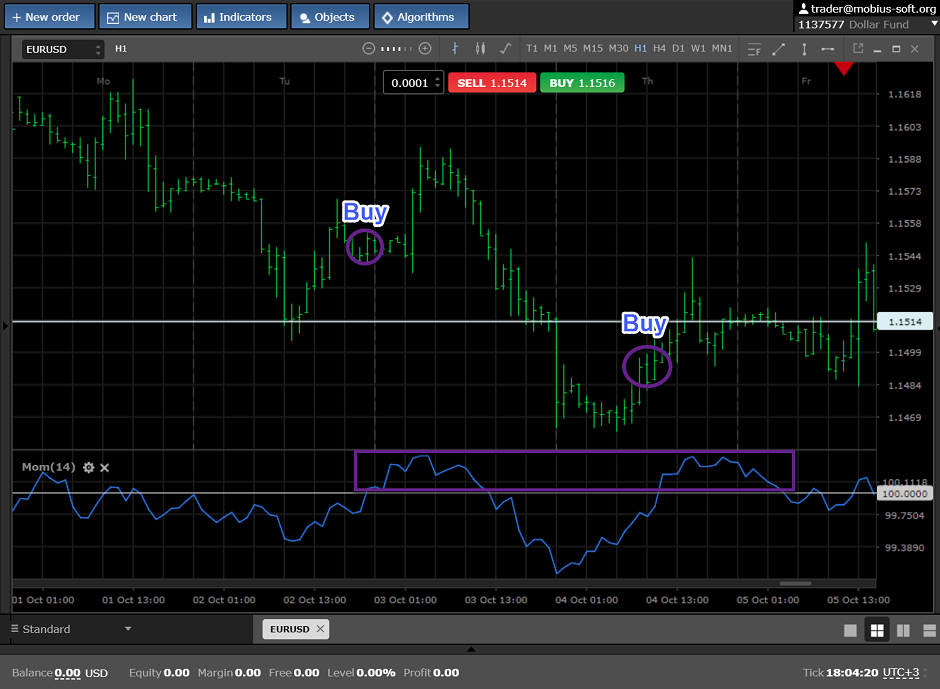
also we sell when the line falls below a mark 100, as shown at the pic. below.
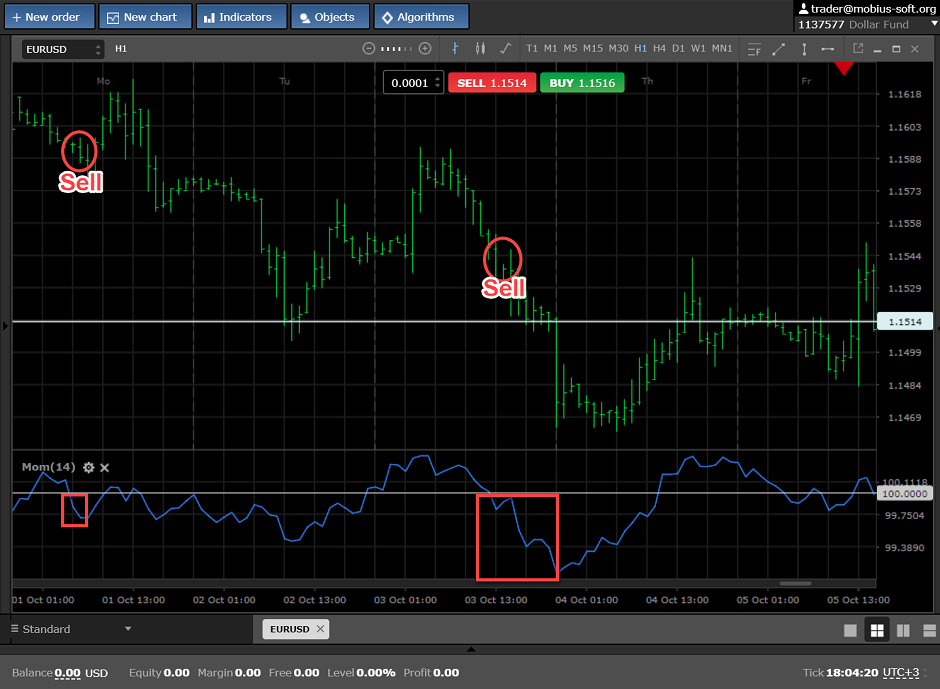
It is better to use the Momentun indicator together with the trend indicator, and it will perfectly suit both beginners, and experienced traders. I wish you success in trade.