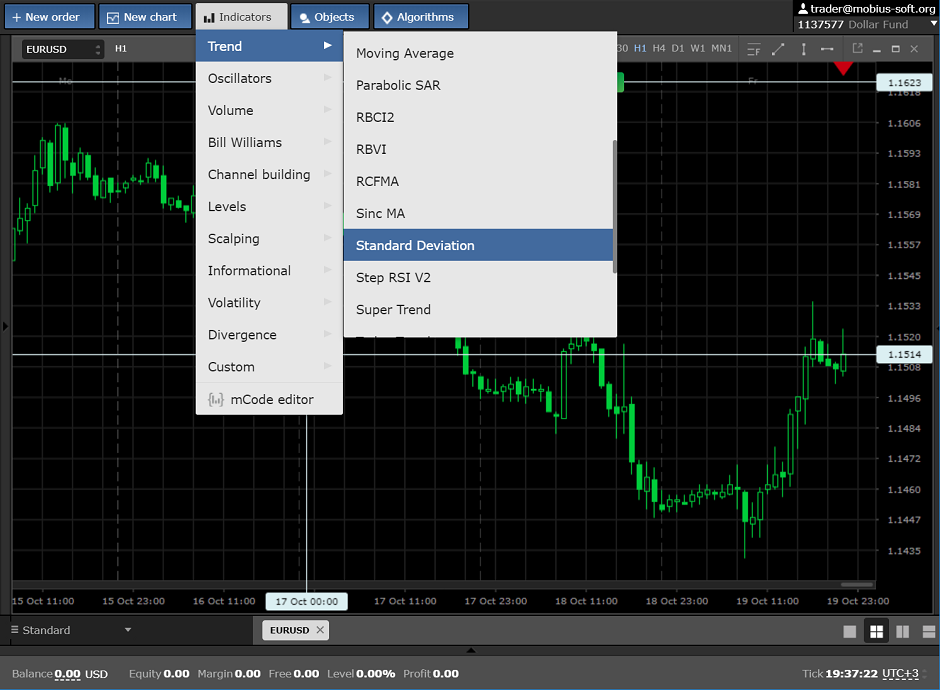
Indicator Standard Deviation
In this overview we would like to tell about the Standard Deviation indicator which enters the family of trend indicators and shows us the market volatility. It is placed in the section Indicators - Trend
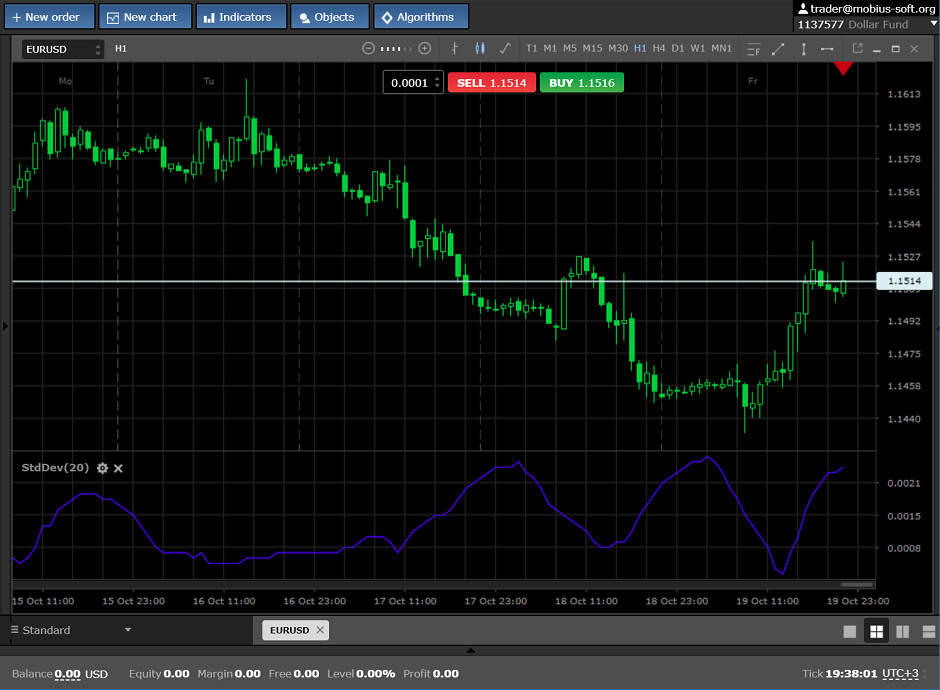
it looks as following:
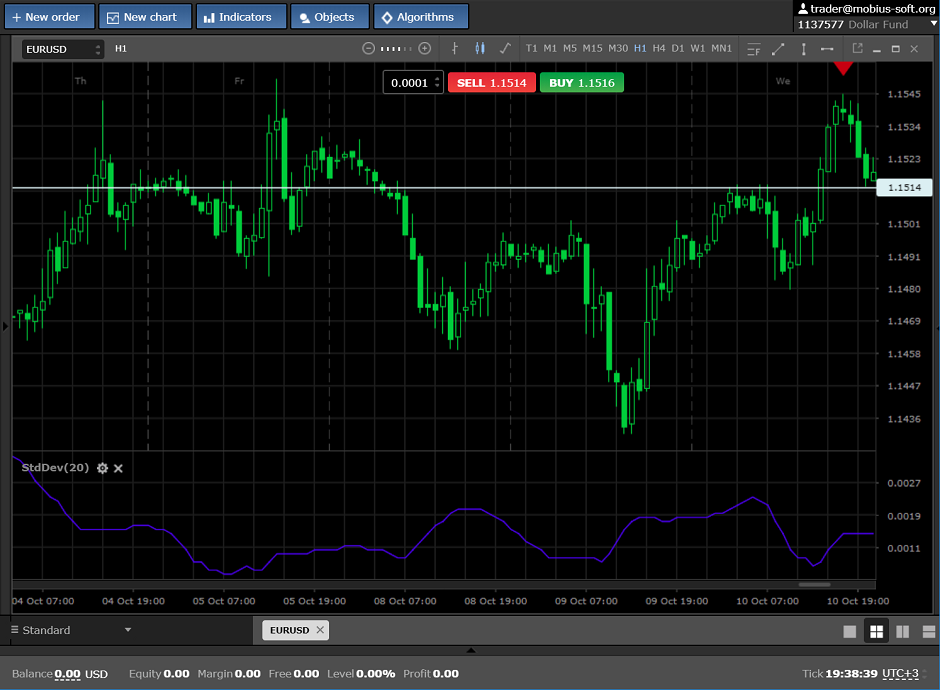
If the line of the indicator approached top of indications, then soon it will be possible to expect lateral motion (flat) or a price turn, as shown at the pic below:
If the Standart Diviation line stands still for a long time and it doesn't move anywhere, then soon it is possible to expect big movement of the price in this or that party,
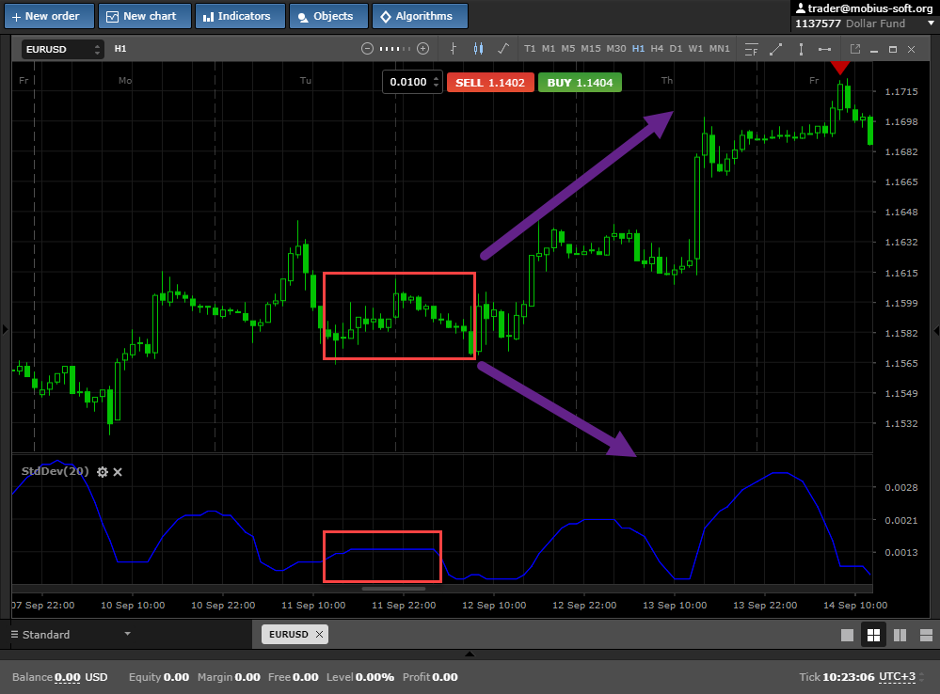
This indicator will suit as a filter to strategies which are based on understanding of the market. We wish you high profit.