Indicator Accumulation Distribution
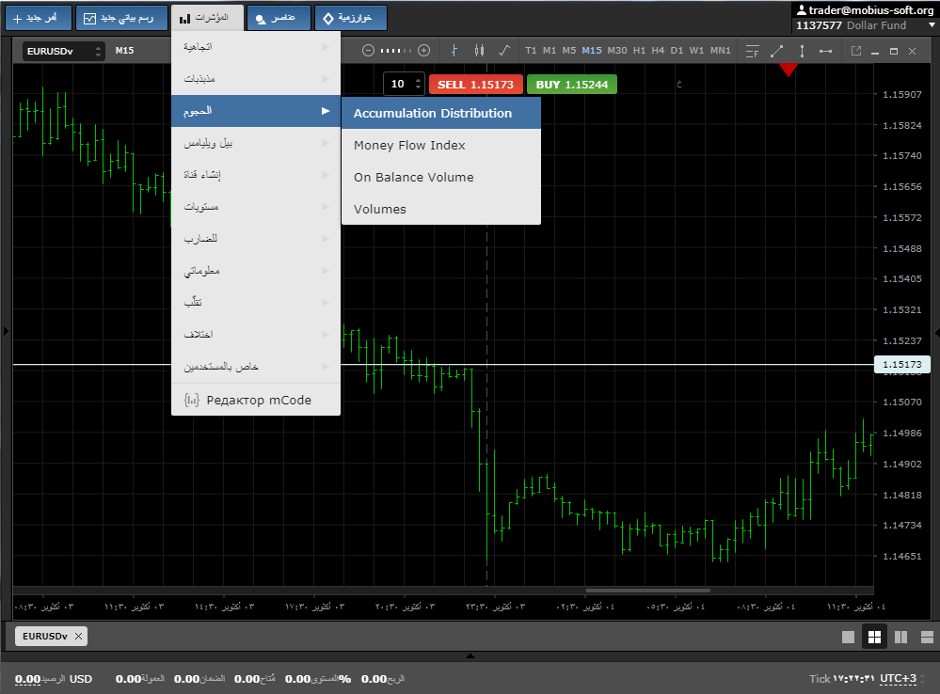
In this overview we would like to tell about Accumulation/Distribution indicator, the main task of which is to determine accumulating and distribution of line items of the traded tool by traders. It is placed in the section Volume

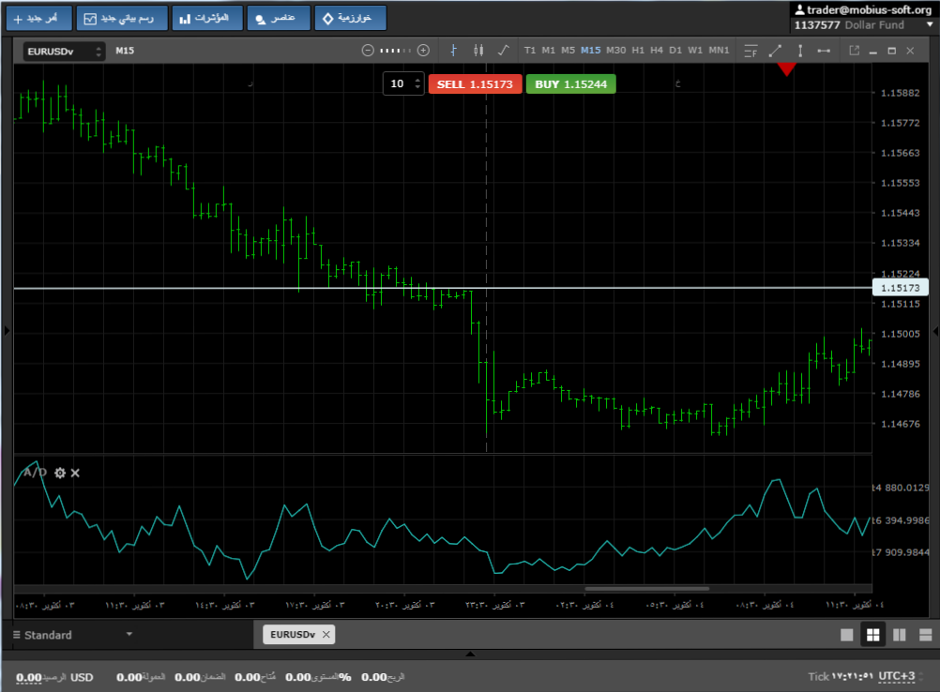
it looks like that:

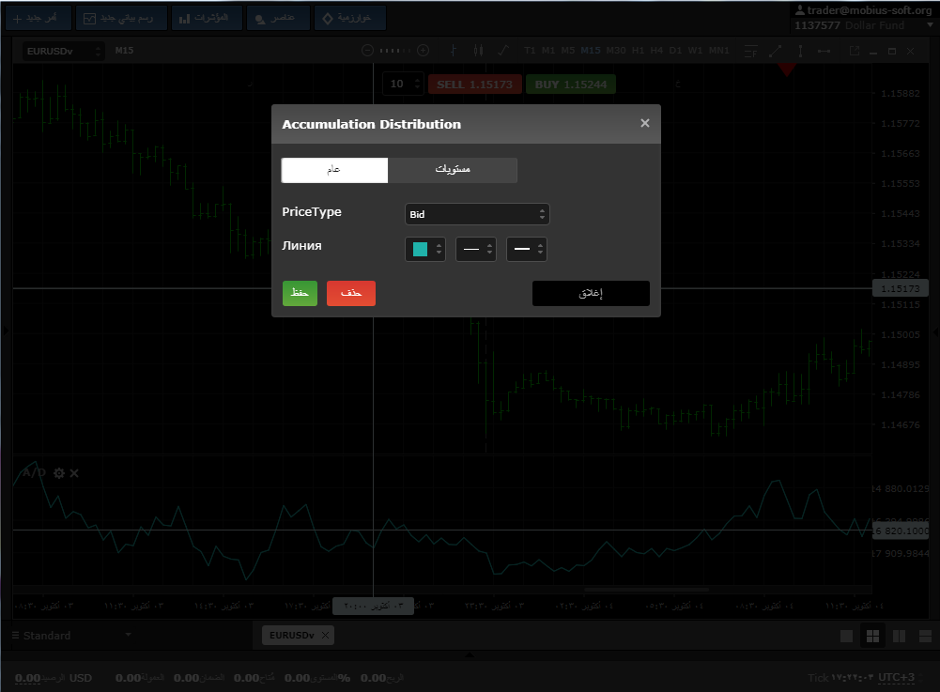
In settings of the indicator it is possible to change only the color and width of the line for the best visual perception of the grahics.

In its indications the indicator uses the price of the traded tool and its tick volume.
The more is the indication of tick volume, the more important will be the site of movement as very often it happens that on a candle of 20 points there was a big tick volume and the line of the Accumulation/Distribution indicator will show us this situation.
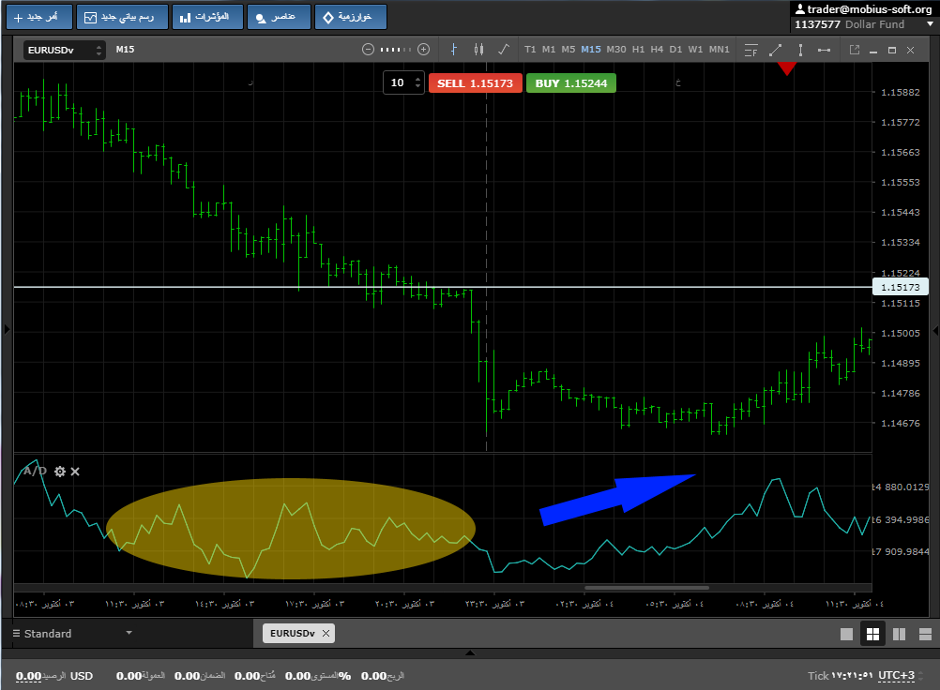
If in case of movement up the volume begins to grow, it means that someone buys up an asset and perhaps the price will turn soon, so in case of movement down if there is a volume, it gives us a signal of sales by traders and respectively in the near future the price can be turn.

It is better to use the Accumulation/Distribution indicator in group with trend indicators for filtering entrances. We wish you high profit.
This indicator can be discussed at forum

 Russian
  中文
中文  English
  Bahasa Indonesia