Indicator On Balance Volume
We present to your attention the OBV indicator (On Balance Volume) which task is to track dynamics of scope change according to the price chart.
It is placed in the section Indicators - Volume
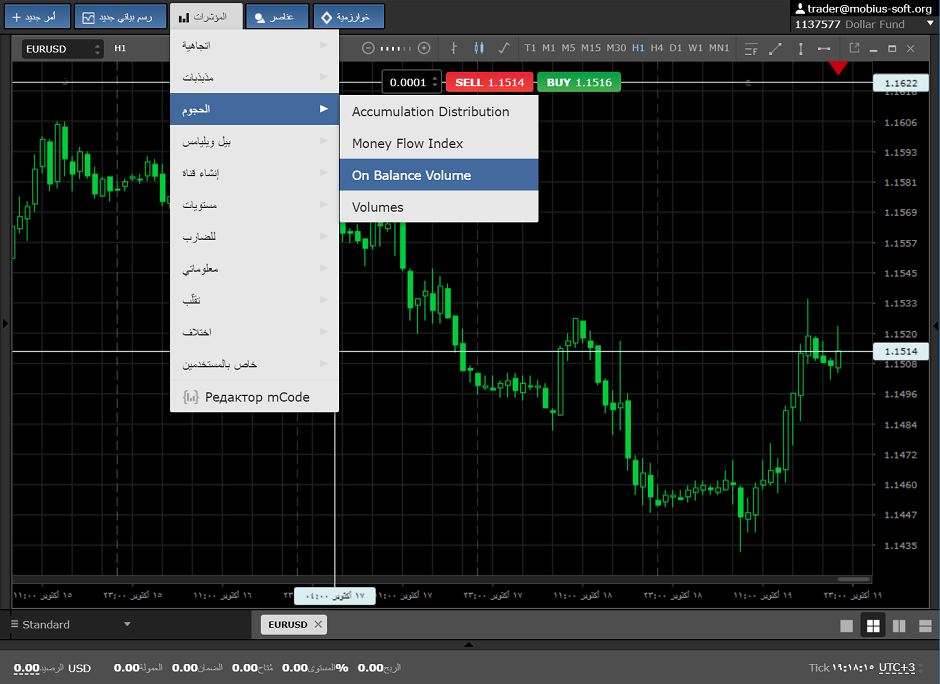
it looks like that:
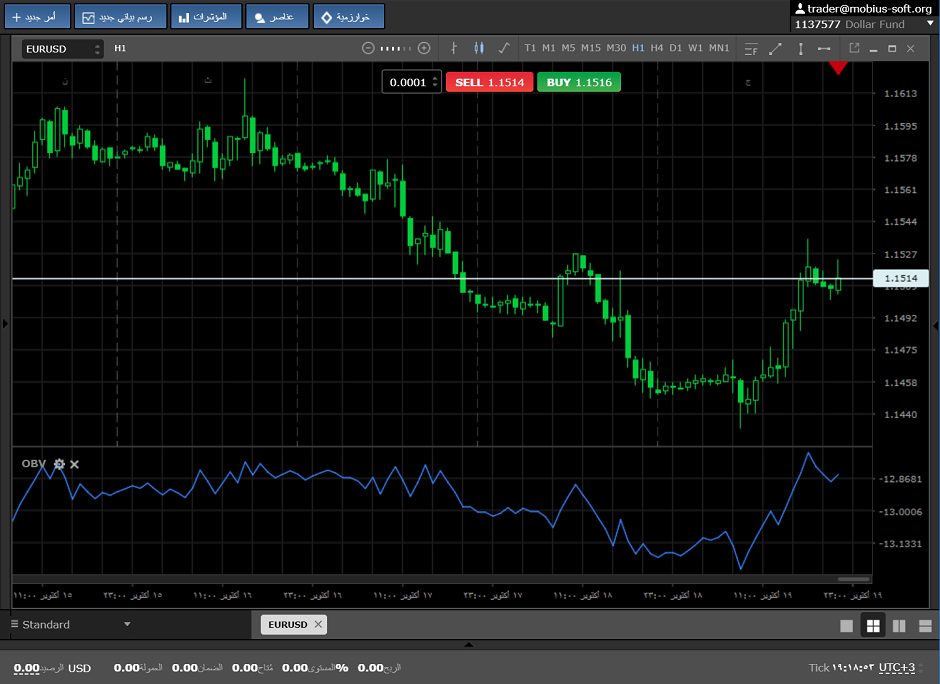
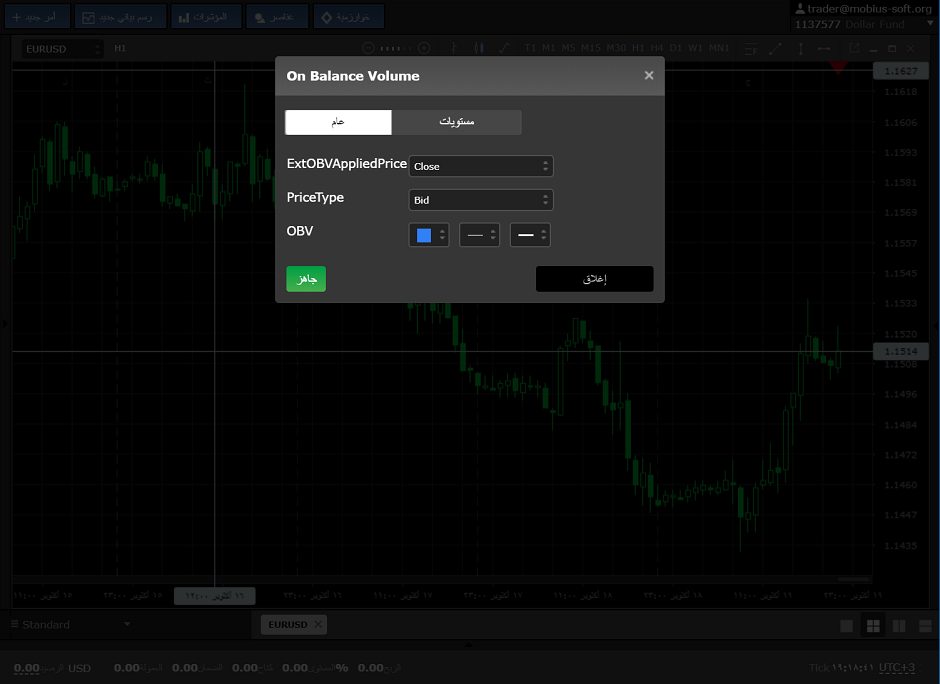
The essence of indications of the indicator is based on the principle if the candle closed H1-D1 is above the previous closing that all volume is directed to the ascending trend and if the candle was closed below the previous closing, then all volume is directed to the descending trend.
If the line of the OBV indicator begins to go up, and on the price chart is consolidation or the descending trend that it says then it says that soon there will be a turn of trend movement or correction. And if in case of the ascending movement or consolidation the price line of the indicator is directed down, then these are prerequisites on a trend turn, as shown at the pic. below.
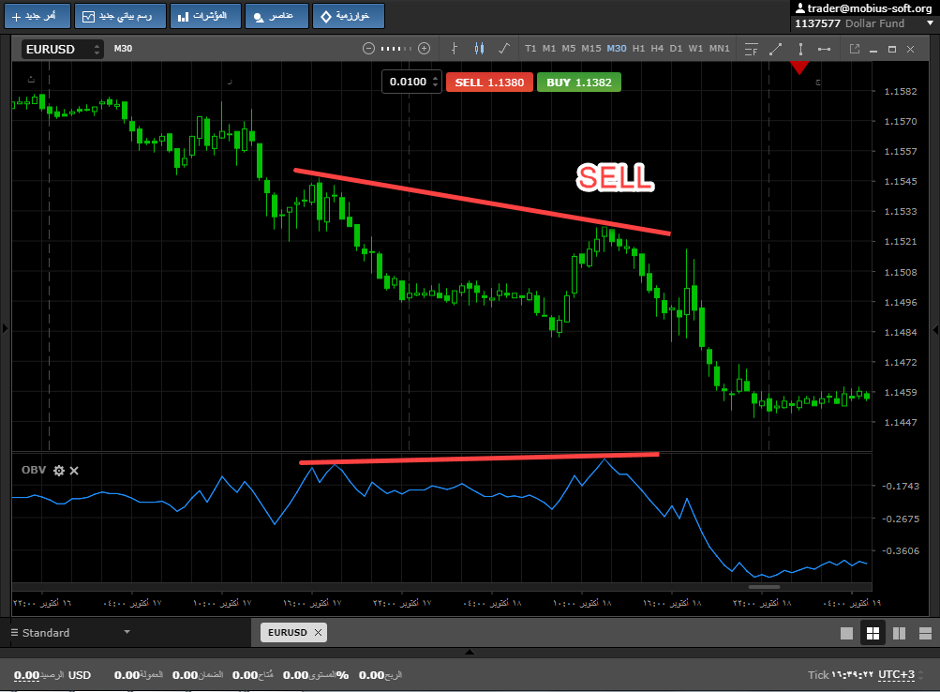
Also on this indicator it is possible to observe and trade the divergence signals.
Divergence on Buy arises when the OBV indicator is deployed up and creates higher hollow in comparison with previous, and the price at the same time moves down and creates lower extremum.
Divergence for Sell when the OBV indicator is developed down and creates local top below previous, and the price at the same time moves up and creates top which is higher than previous.
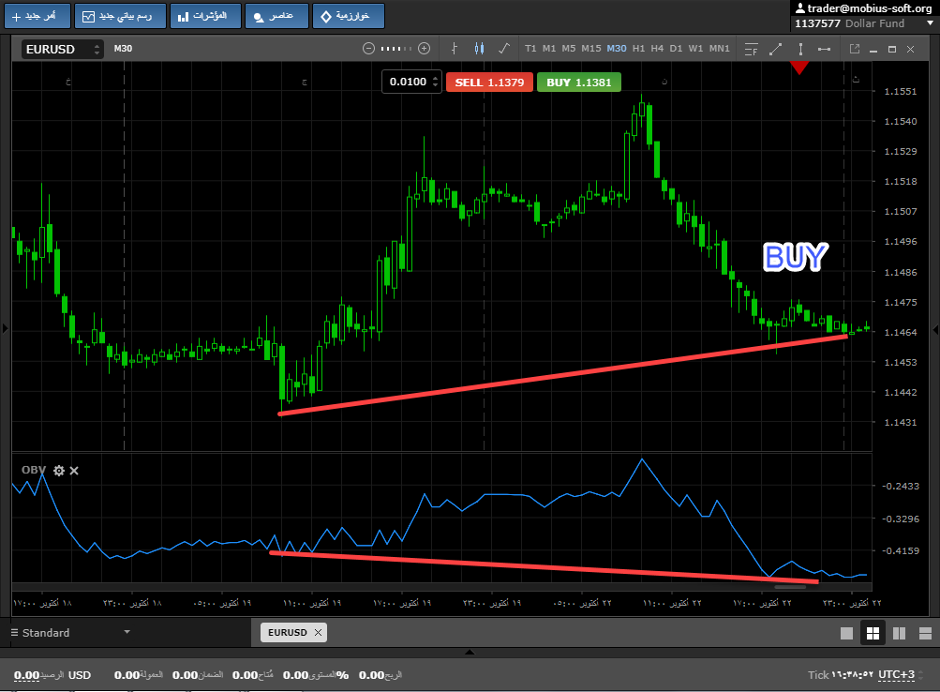
The On Balance Volume indicator will be perfect both for beginners, and skilled traders for filtering transactions or even short-term trade on one indicator. We wish you high profit.
This indicator can be discussed at a forum

 Russian
  中文
中文  English
  Bahasa Indonesia