
 Russian
  中文
中文  English
  Bahasa Indonesia
 Indicator Relative Strength Index
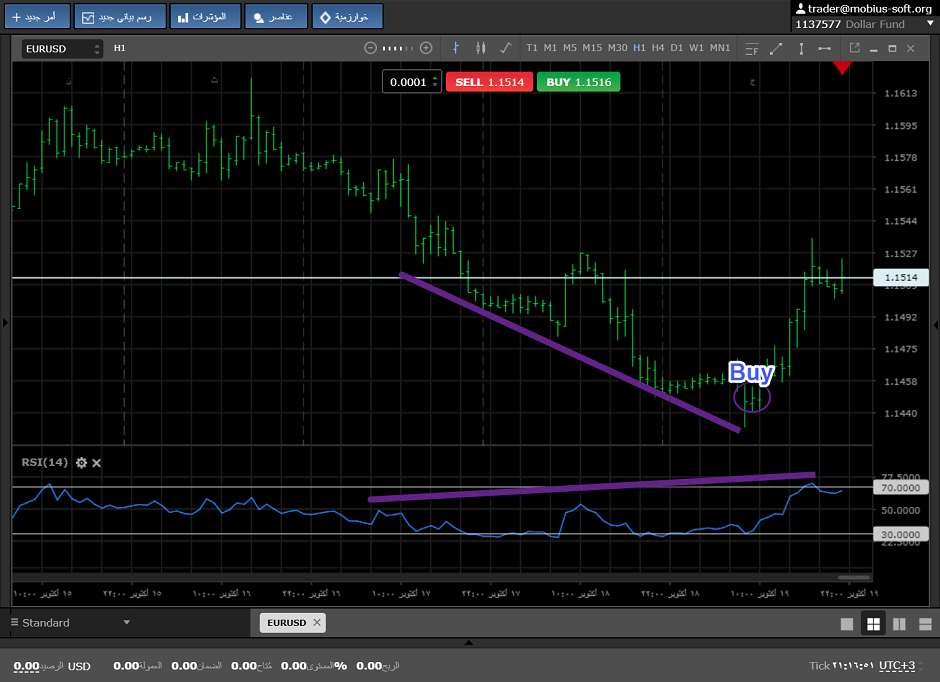
One more very popular indicator is RSI which task is to create a signal on the basis of price analysis for a certain period of time. It is placed in the section Indicators - Oscillators
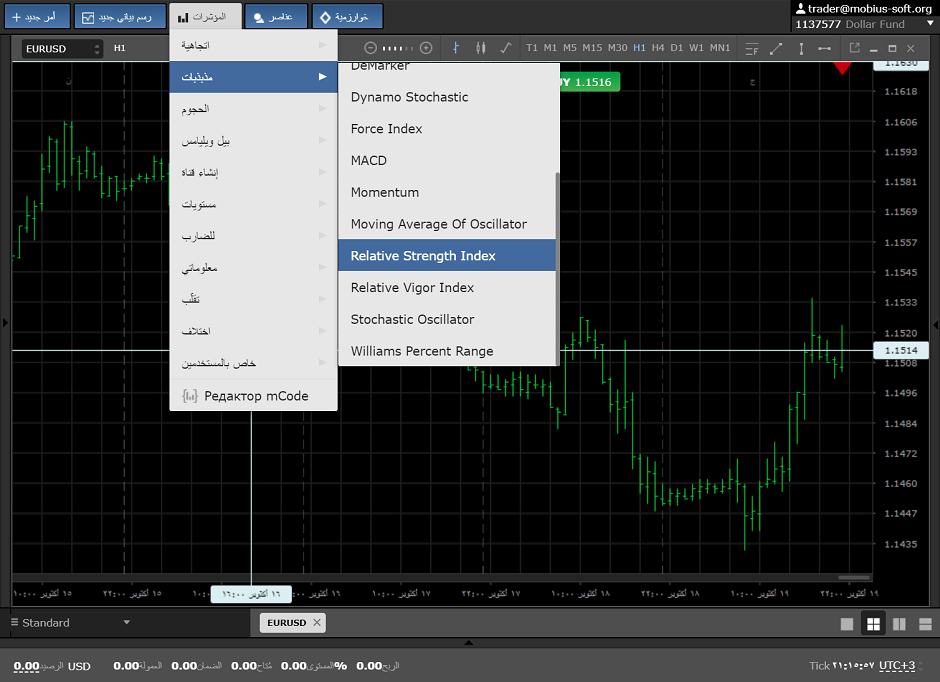
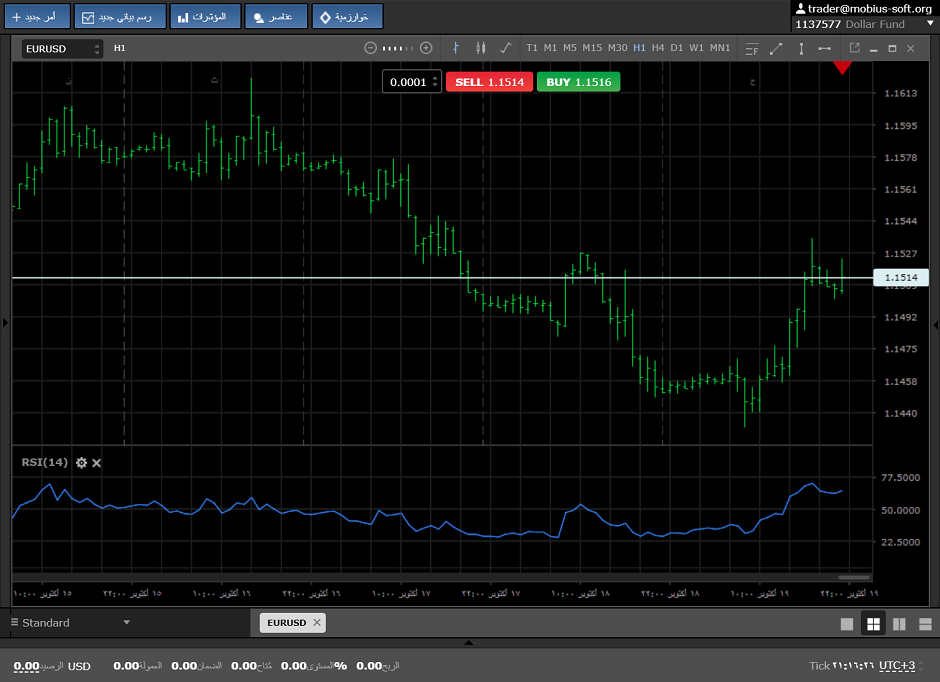
it looks as following:
In settings of the RSI indicator it is possible to change the period from the standard 14,
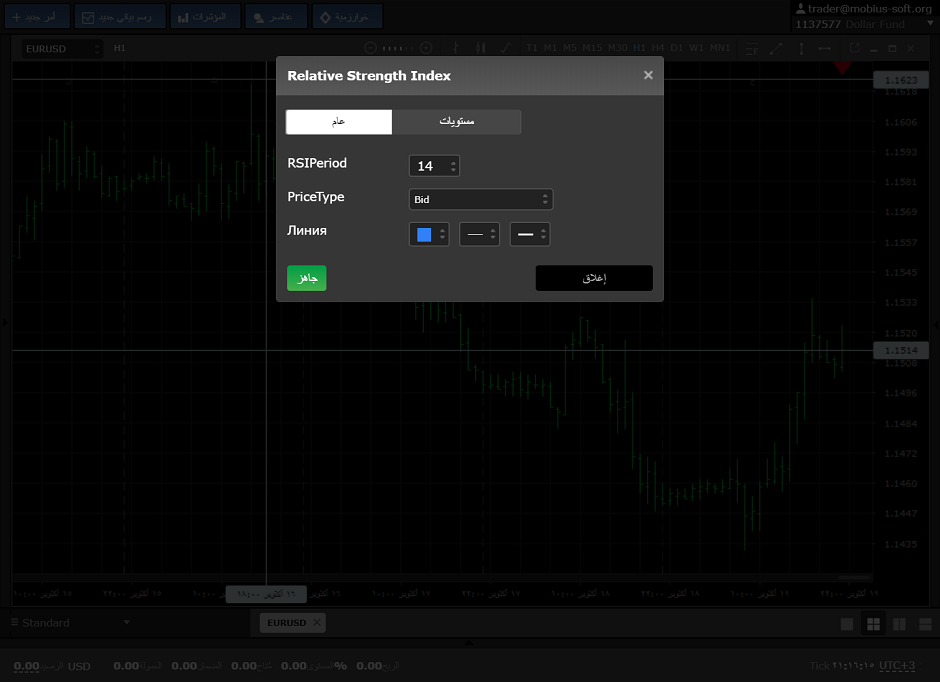
on that which will suit you. Color, style and width of the histogram, and levels, indicators of which according to the standard are 30 and 70.
This indicator gives such signals as:
- overbuy and oversell. It is necessary to open the transaction for sell when the line of the indicator crossed level 70, and on buy if the price fell lower than the level 30, as shown at the pic. below.
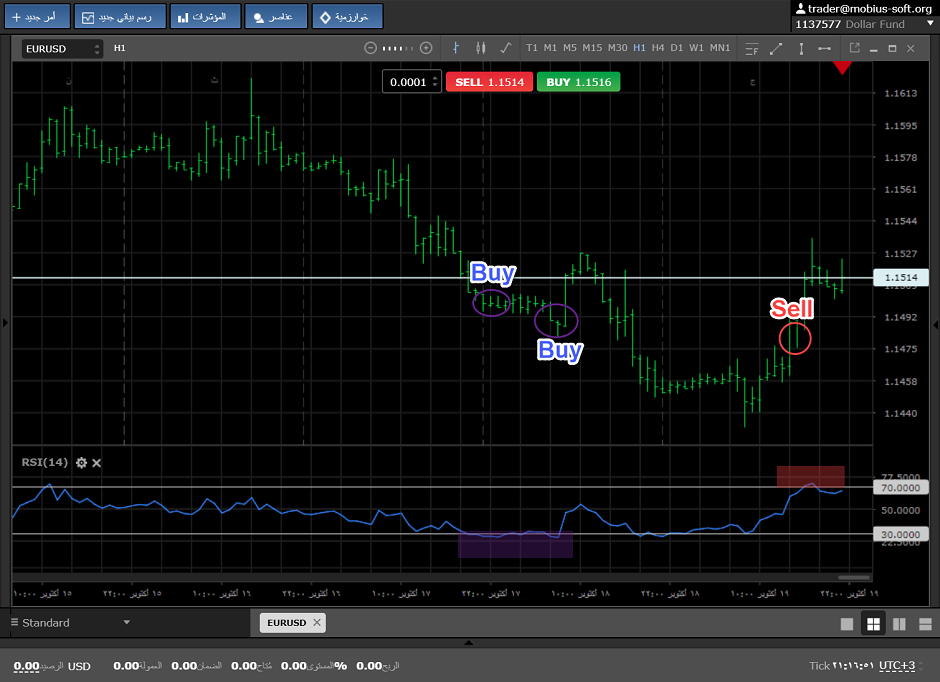
- divergence;
All these signals can be used in trade, both in a complex, and individually.
This indicator is possible to apply together with other indicators to comparison of indicators to reduce the number of unprofitable transactions. The RSI indicator will be useful both to beginners and professionals. I wish you successful trade.
This indicator can be discussed at forum