Parallel lines
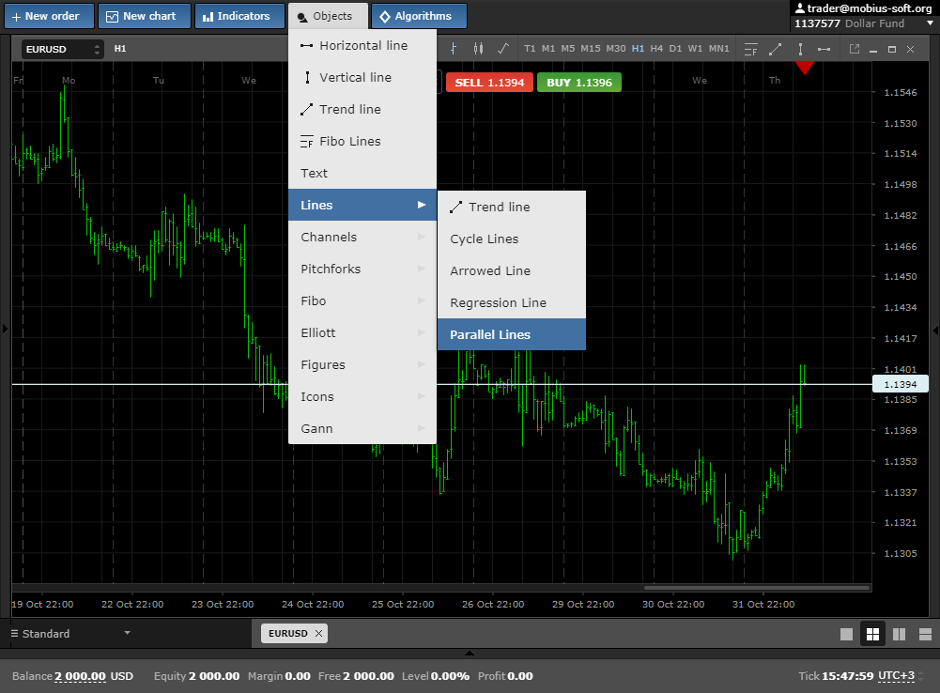
To set parallel lines at the price graphics it is necessary to choose Objects - "Lines" - "Parallel lines", as shown at the pic below.
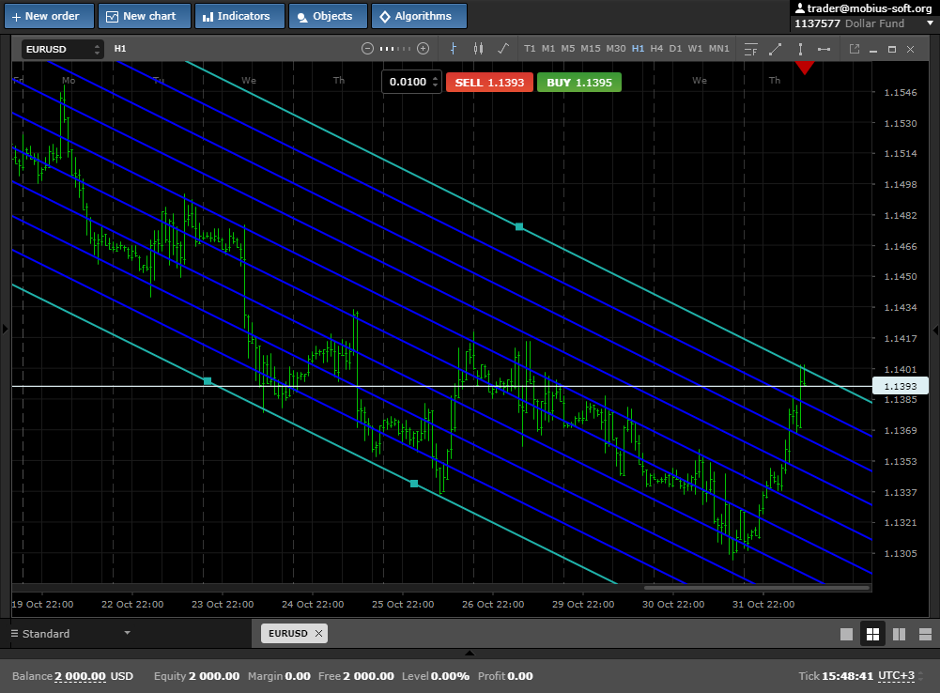
After choosing the parallel lines it is necessary to click at any place on chart and to choose three points on which will be drawn the lines
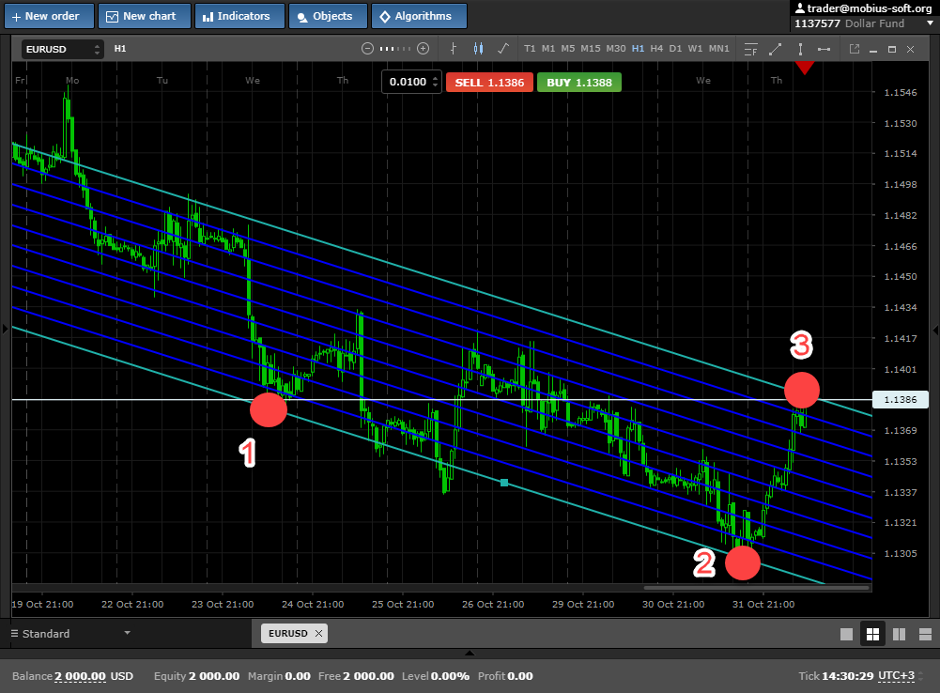
It is necessary to build lines as shown at the pic below. At first point 1, then point 2 and 3.
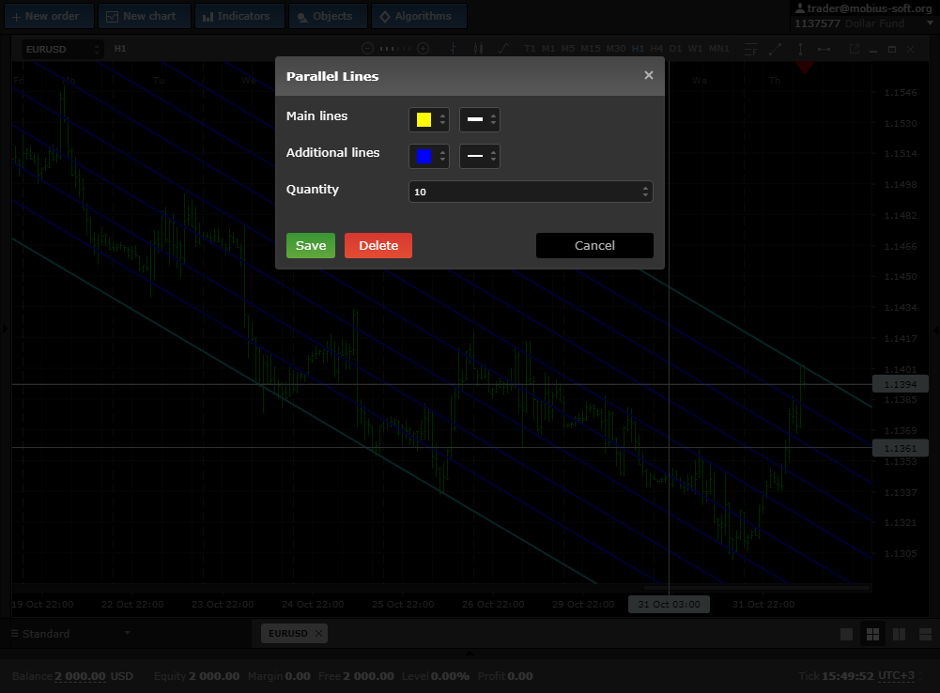
In a window of property it is possible to set the number of lines between main (borders) from 1 to 10, and also color and thickness of lines.
For descriptive reasons of working off after installation of lines you can choose the smaller time period.
In this view of lines various used differrent percent between points 1 and 3, on similarity of percent of Fibo - 0.214, 0.382, 0.50, 0.618 and 0.7856 and the closer is the blue line to the last yellow line (border of the channel), the more likely we can expect a rebound.
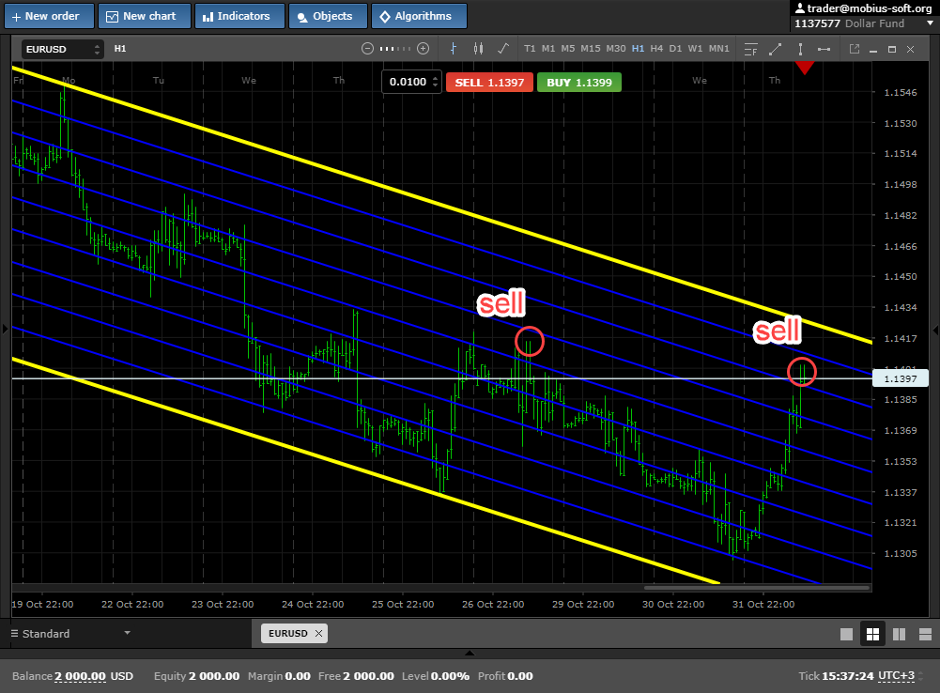
If the price overstepped the bounds of the channel it is possible to try to open the doubled lot. We wish you high profit.
This graphical element can be discussed at forum