
 Russian
  中文
中文  English
  Bahasa Indonesia
 Indicator Awesome Oscillator
In this overview we would like to tell about Awesome Oscillator, which task is to determine a turn of a trend and a driving force of the market. It is placed in the section Indicators - "Bill Williams"
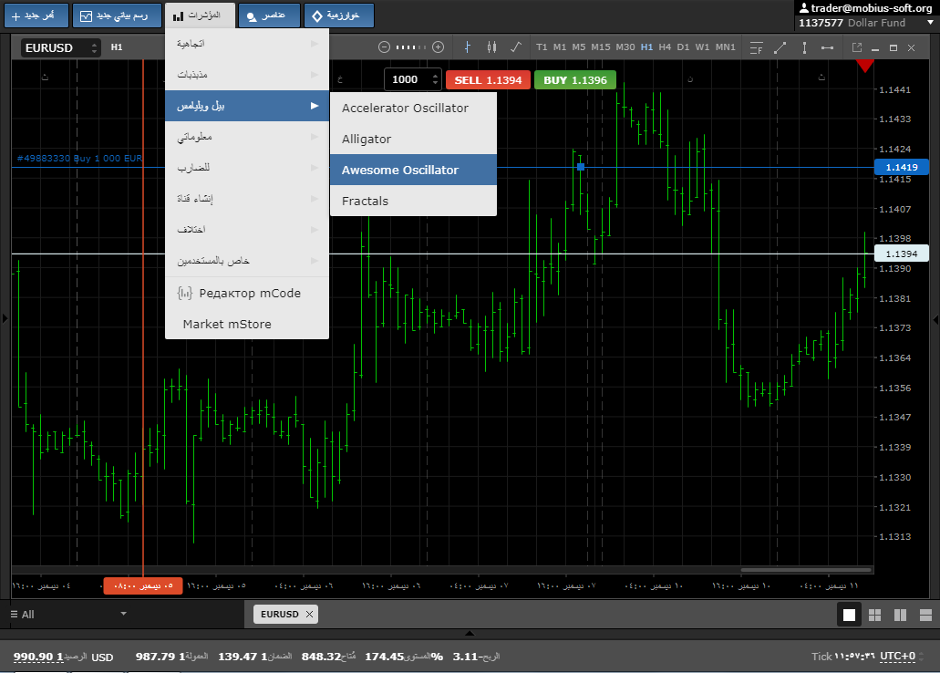
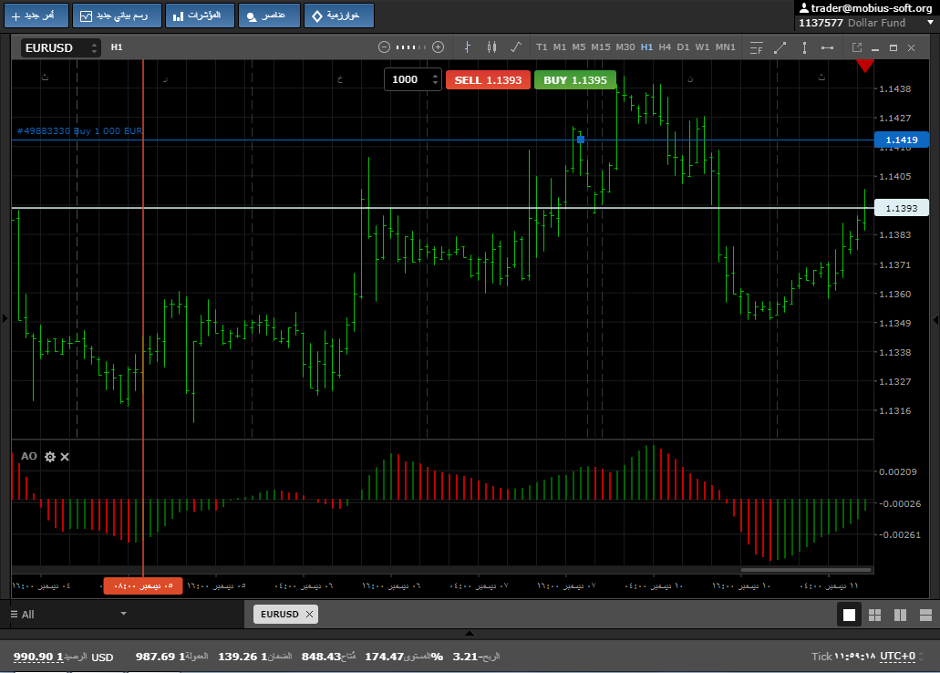
it looks as follows:
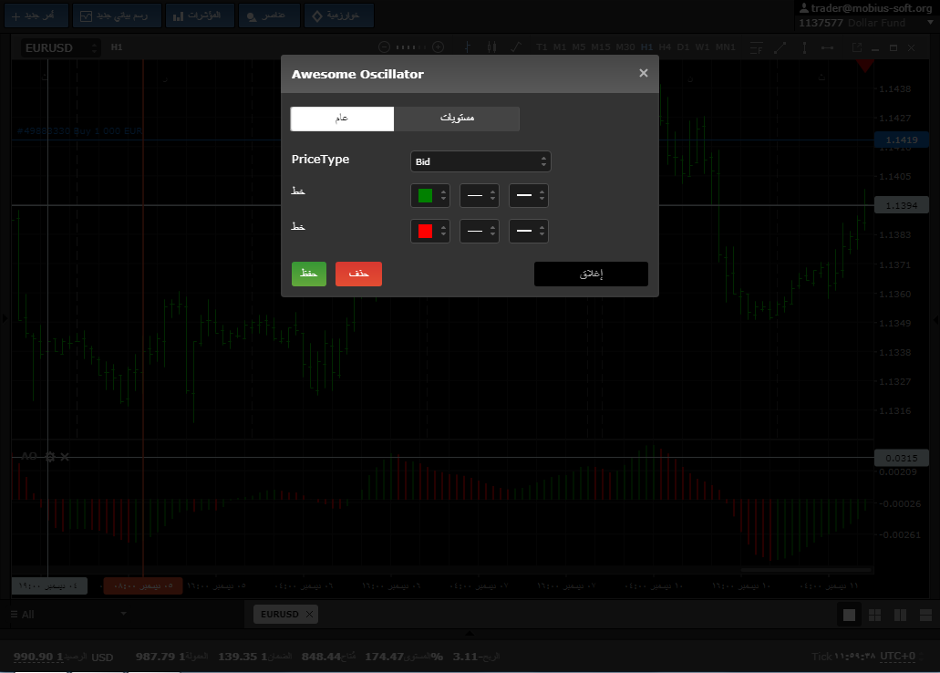
In settings of the indicator it is possible to change color scale and to enter value of levels
There are three signals of the Awesome Oscillator indicator:
The first so-called "saucer" -
For this we need only 3 lines of the histogram. It is important to note that all its histograms shall be either above, or below zero. If at least one of them is in other place - the setup is cancelled.
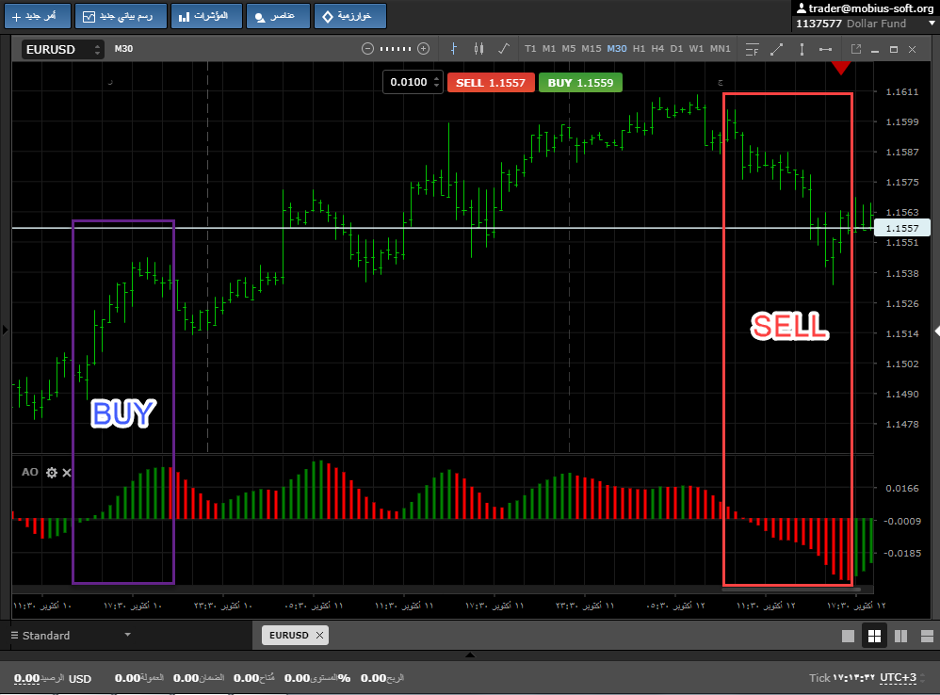
For buy of the financial instrument it is required forming of a saucer in a zone above zero. The arrangement of columns shall be the following: the first has bigger value, than subsequent. The last shall be more than previous, as shown at the pic below.
For Sell this figure shall be formed below zero.
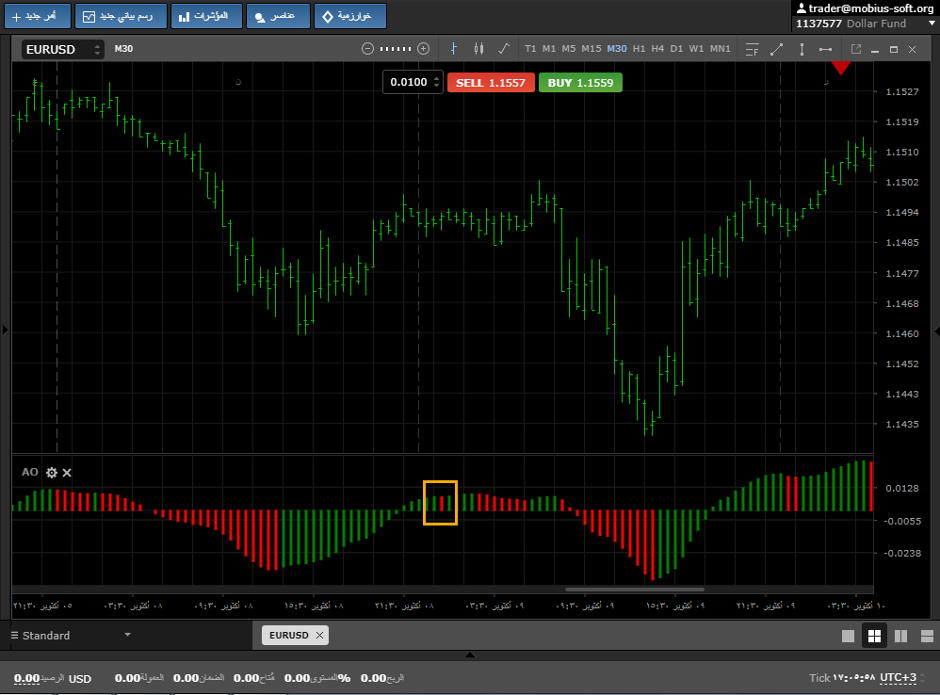
The second signal on Buy is crossing by the histogram of a mark zero for Sell from top to down, and for Buy, from below up.
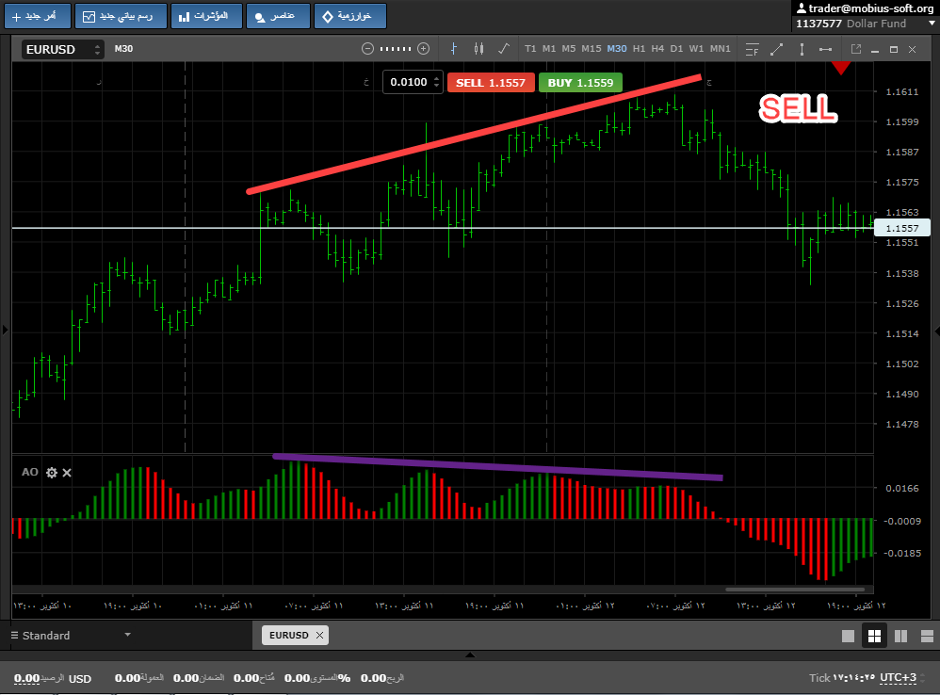
The third signal is called "two peaks" or divergence. For Sell the signal shall appear in a zone above zero, and for Buy in a zone - lower than zero, as shown at the pic below.
This indicator used by many traders because of its multifunctionality. In the technical analysis - Awesome Oscillator will become the irreplaceable assistant in trade. I wish you success.
This indicator can be discussed at forum