
 Russian
  中文
中文  English
  Bahasa Indonesia
 Indicator RBCI2
We present to your attention the RBCI2 indicator which is an innovation of trend indicators as in its basis there are unusual lines of overbuy and oversell. It is placed in the section Indicators - Trend
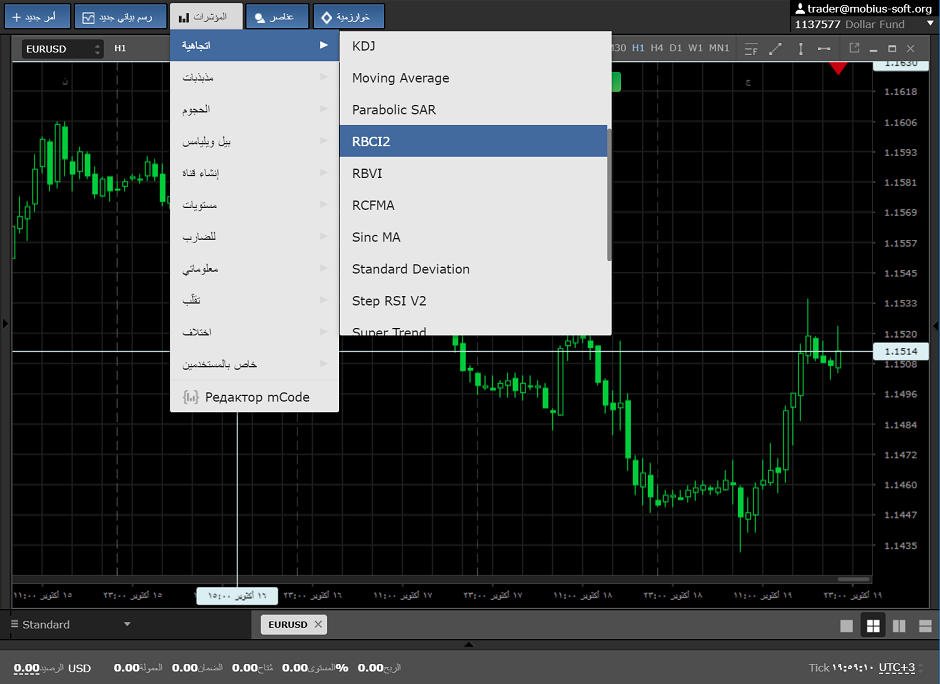
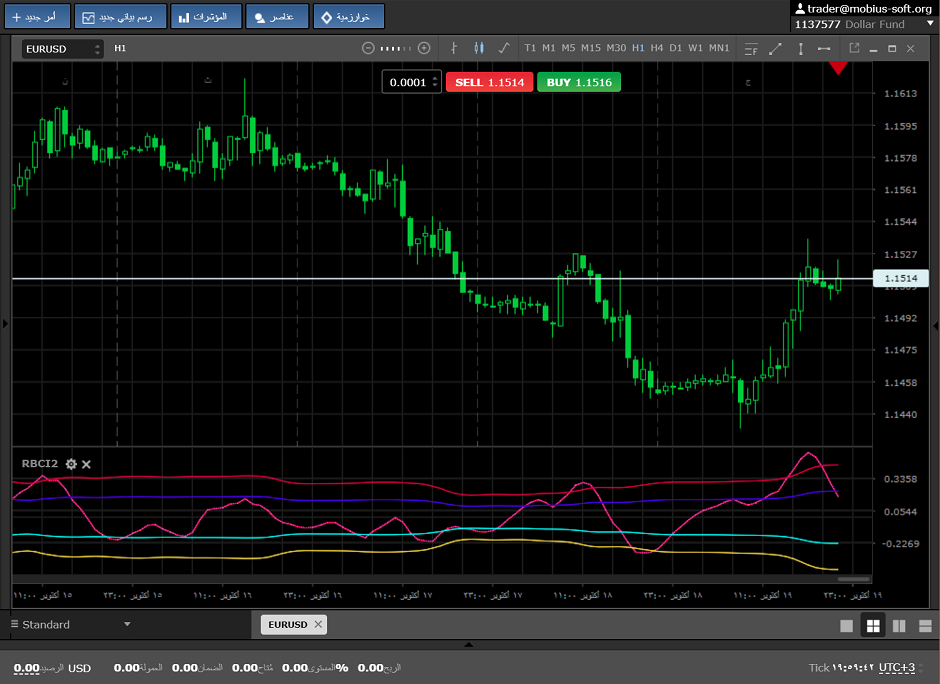
it looks as following:
Settings of the indicator:
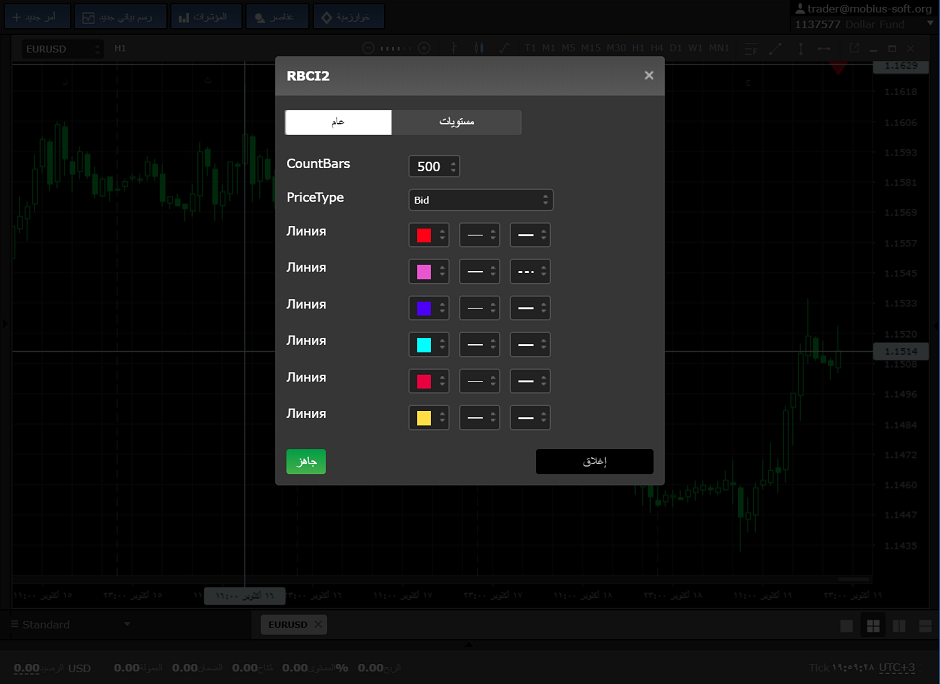
In them it is possible to specify the number of bars on which the indicator will draw the values, and also to give to each line the color and width, for better perception on the price chart.
It is possible to buy on this indicator when the pink line touches the blue, and better yellow horizontal level.
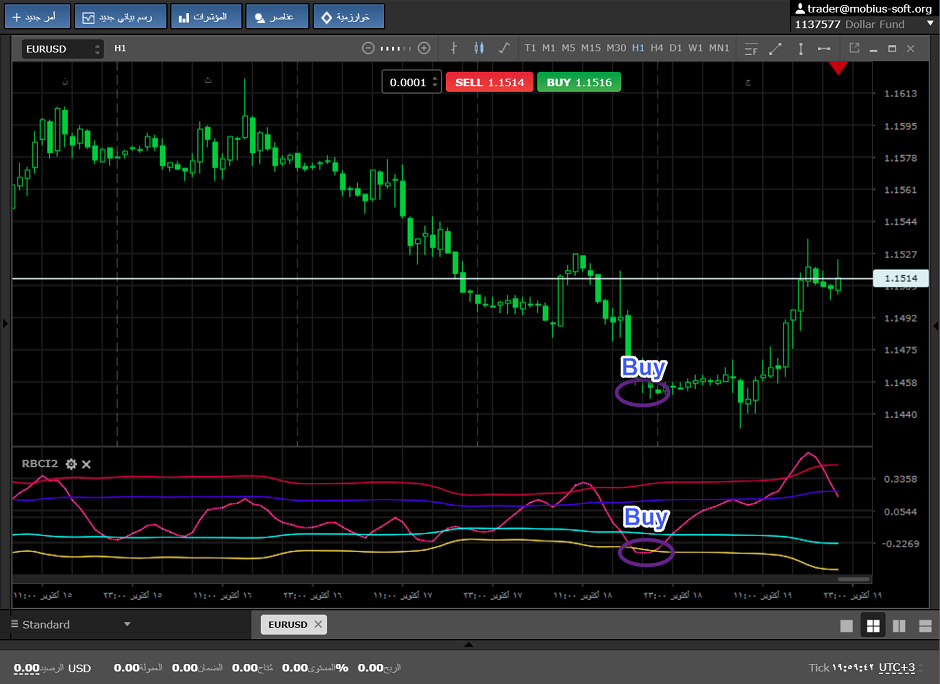
We sell when the pink line touches blue or red horizontal level, as shown at the pic below:
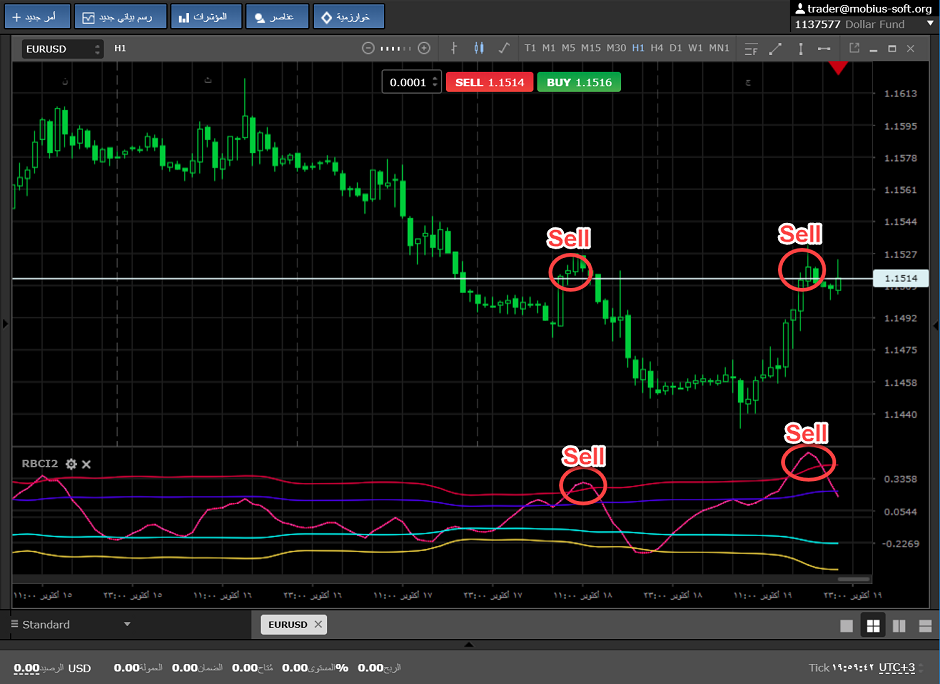
This indicator will perfectly suit beginners as it adapts to the market and they don't need to do anything. We wish you high profit.
This indicator can be discussed at forum