
 Russian
  中文
中文  العربي
  Bahasa Indonesia
 Inception chapter
Step-by-step instructions for creating a custom indicator
1.1 Create the initial template
- We start the mCode editor in any way: there is a corresponding button in the menu on the right,
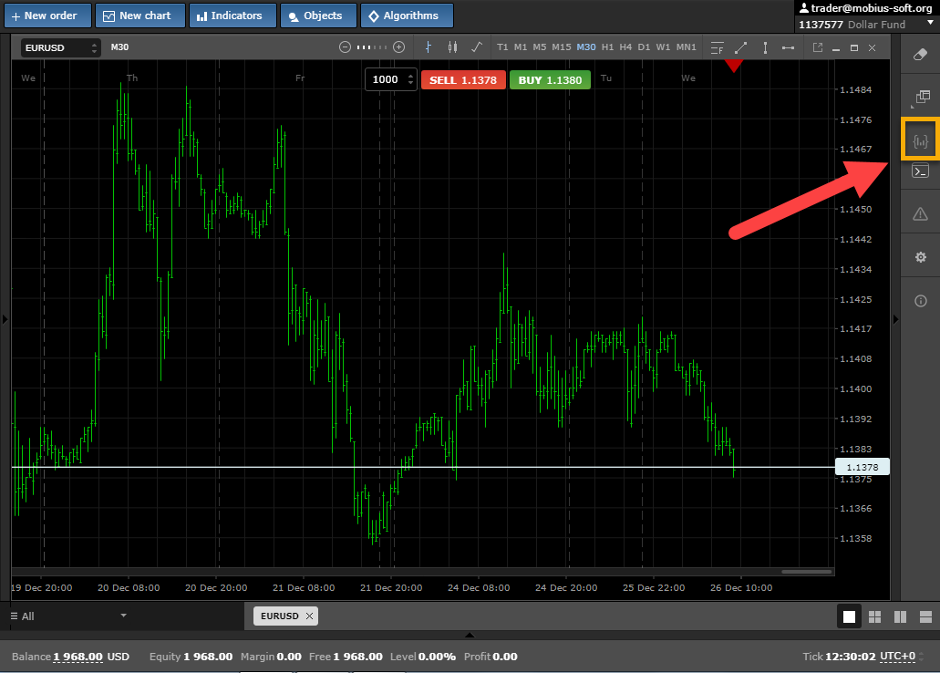
and in the Indicators menu - the corresponding item.
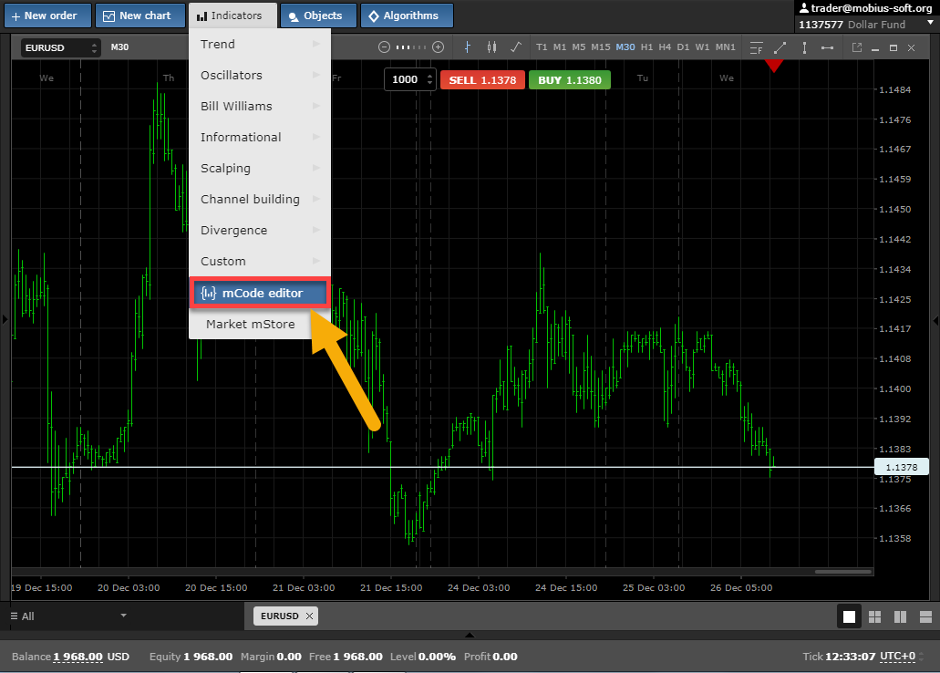
- In the editor window that opens, click the Create Indicator button.

- In the dialog box that opens, set the file name, which will become the indicator name in the list of user indicators of the trading terminal.
Accordingly, the name of the indicator is given in Russian if we want to see it in the list in Russian, and vice versa. The editor allows spaces in the file name, but they are best avoided for reasons of operating system compatibility; instead of a space, it is better to use an underscore after restarting the terminal, these characters in the indicator name in the list of custom indicators will be replaced by spaces and readability will not be affected.
Enter the file name (no need to specify the extension) - click the Add button. The file name appears in the list on the left.
To the left of the file name there will be a symbol - a dot, while gray; it will turn green when we activate the indicator, but before that the template created for us needs to be filled with content so that it becomes a valid indicator.
The standard template proposed by the mCode editor at the time of writing this text looks like this:
export class Main extends Indicator {
    constructor() {
        super();
        this.addInput("PriceType", InputType.PriceType, PriceType.Bid);
        this.buffer = this.addBuffer();
    }
    onInit() {
    }
    async onUpdate() {
      }
}
This code does not do anything useful from a user point of view. We have to make a useful program out of it.
1.2 The simplest indicator
Let's start with the simplest version of the indicator: we will draw a line connecting the Close points of each bar, while we will not ask the user any questions.
export class Main extends Indicator {
    constructor() {
        super();
		this.buffers = {
            BufferForLine1 : this.addBuffer(),
        };
    } // end of method constructor
	onInit() {
        this.buffers.BufferForLine1
        .setShape(Shape.Line)
            .setColor(Color.OrangeRed)
        ;
    } // end of function onInit

	async onUpdate() {

	  const PriceType = 0,
		{BufferForLine1} = this.buffers,
			{
          Close,
         } = await Bar.load([
                Bar.Mode.Close,
            ], PriceType),
         barSize = Close.length;
		for (let i = 0; i < barSize; i++) {
            BufferForLine1.set(i, Close[i]);
        } //end of cycle
    } // end of onUpdate function
} // end of indicator code
JavaScript is used for programming indicators. Let us explain the meaning of a standard set of functions and methods.
The minimum indicator construction consists of three methods: constructor, onInit and onUpdate. Constructor method creates the objects necessary for the indicator to work; onInit initializes the indicator, is executed immediately after loading by the client terminal; onUpdate executed every time new data arrives.
Let's consider each of them in a little more detail.
    constructor() {
        super();
        this.buffers = {
            BufferForLine1 : this.addBuffer(),
        };
    }
In the constructor, the super keyword is used as a function that calls the parent constructor. It must be called before the first call to the this keyword in the body of the constructor.
Then we create the necessary buffers for work; in this case, there is only one buffer, we give it the name BufferForLine1.
onInit() {
        this.buffers.BufferForLine1
          .setShape(Shape.Line)
          .setColor(Color.OrangeRed)
        ;
    }
onInit - The indicator initialization procedure is executed immediately after loading by the client terminal. In it, we determine the properties of the buffer we created:
.setShape (Shape.Line) - set the type of chart: line
.setColor (Color.OrangeRed) - set the default line color; in the dialog box, you can select another.
async onUpdate() {
	  const PriceType = 0,
	{BufferForLine1} = this.buffers,
        {
          Close,
         } = await Bar.load([
                Bar.Mode.Close,
            ], PriceType),
         barSize = Close.length;

      for (let i = 0; i <= barSize; i++) {
            BufferForLine1.set(i, Close[i]);
        }
    }
onUpdate is a standard function that is executed every time new data arrives. async this function is asynchronous, in it we use the await expression: program execution is suspended until all data is received.
PriceType = 0: price type (bid or ask) we will set explicitly; in future versions of our indicator, we will request the option you need from the user.
{BufferForLine1} = this.buffers: pass the data of our buffers to the method.
{
   Close,
  } = await Bar.load([
            Bar.Mode.Close,
         ], PriceType)
- request Close data for all bars for the corresponding PriceType price type and wait for the corresponding array to be filled.
barSize = Close.length; - set the value of the barSize constant equal to the number of elements in the Close array.
And finally, a cycle through i with a step of one bar from the last (current, zero) bar to barSize:
for (let i = 0; i < barSize; i++) {
            BufferForLine1.set(i, Close[i]);
 }
We put Close array data into the buffer array, in this case without any additional processing of this data. This is what leads to the display of the line on the chart.
Having created the program code in the mCode editor, press the
We go to the trading terminal, select the chart of the desired currency pair, and add our indicator to it through the menu Indicators - User - Your_Indicator_Name. In the dialog box that appears in this case, you can change the color of the line, its thickness and type to your liking.
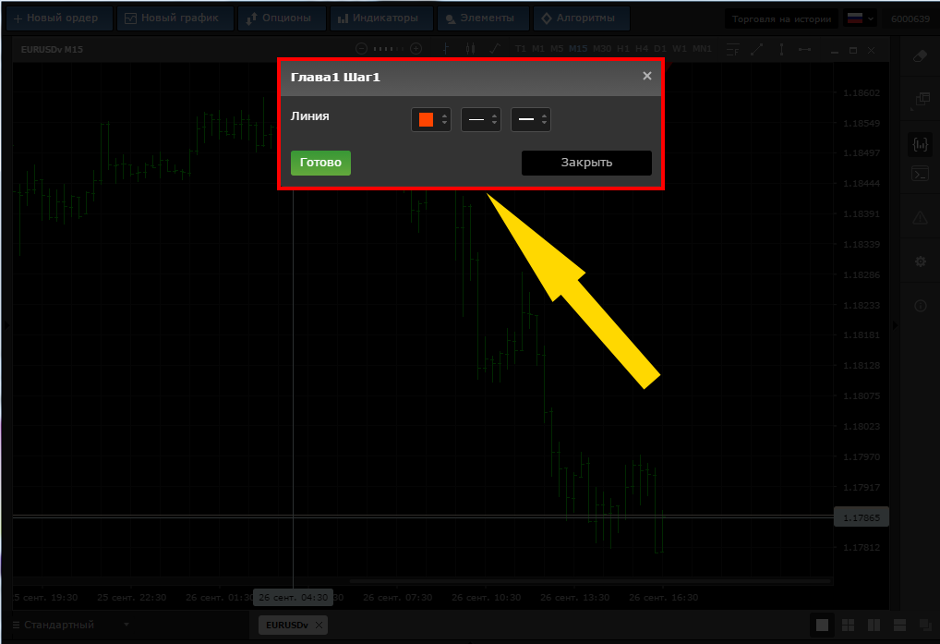
If everything is done correctly, the result of the indicator will be displayed in the chart window in the form of a line of the specified color and a view connecting the Close points of each bar:

1.3 Let's complicate our indicator a bit: add a second line connecting the Open points of each bar
export class Main extends Indicator {
    constructor() {
        super();
        this.buffers = {
            BufferForLine1 : this.addBuffer(),
            BufferForLine2  : this.addBuffer(),
        };
    } // end of method constructor
    onInit() {
        this.buffers.BufferForLine1
            .setShape(Shape.Line)
            .setColor(Color.OrangeRed)
        ;
        this.buffers.BufferForLine2
            .setShape(Shape.Line)
            .setColor(Color.Khaki)
        ;
    } // end of function onInit

    async onUpdate() {
      const PriceType = 0,
	{BufferForLine1, BufferForLine2} = this.buffers,
        {
          Close,
          Open,
         } = await Bar.load([
                Bar.Mode.Close,
                Bar.Mode.Open,
            ], PriceType),
         barSize = Close.length;

        for (let i = barSize - 1; i >= 0; i--) {
            BufferForLine1.set(i, Close[i]);
	BufferForLine2.set(i, Open[i]);
        } //end of cycle
    } // end of onUpdate function
} // end of indicator code
What have we done to add a second line?
- in the constructor added the creation of another buffer BufferForLine2;
- in onInit added setting the properties of this new buffer;
- in onUpdate added a data request for it;
- in the same place, the BufferForLine2 filling with the values of the Open array was added to the loop body.
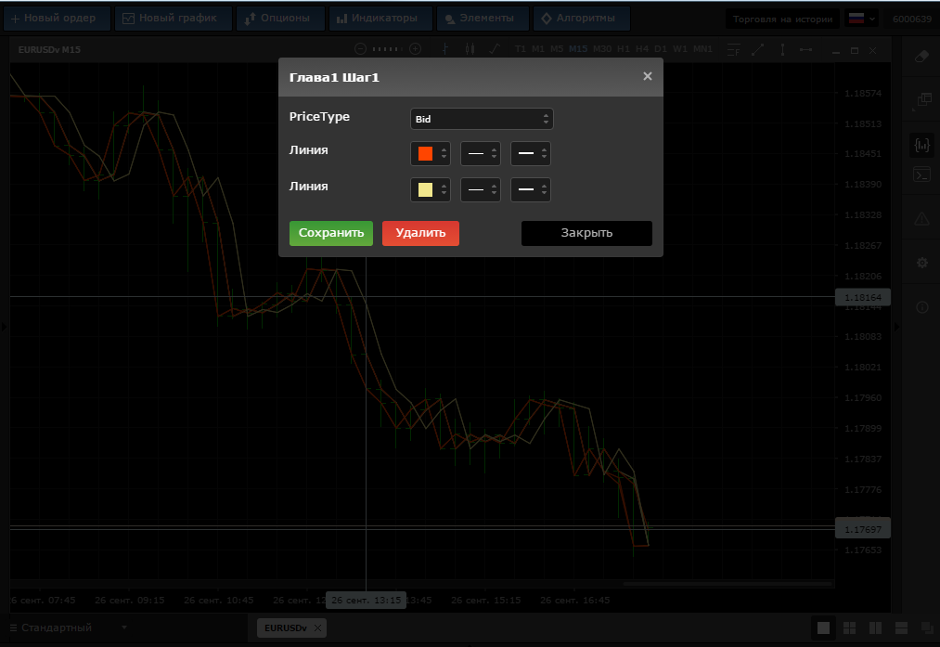
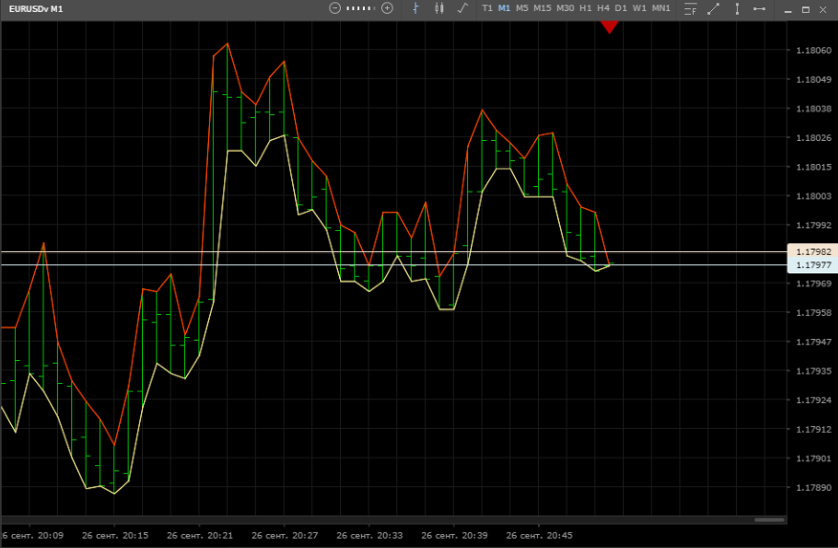
Easy, right? Having saved an improved version of the indicator, we get the desired two lines on the chart:

We also note that we have changed the order of enumerating the values of the variable i, replacing for (let i = 0; i
(mtrader7.com/ru/docs/Terminal/mScript/JavaScript/v1/Buffer/setDrawBegin)– and it is in that order that we now deliver the data to the buffer.
1.4 Add some interactivity
export class Main extends Indicator {
    constructor() {
   super();
   this.addInput("PriceType", InputType.PriceType, PriceType.Bid);
        this.buffers = {
            BufferForLine1 : this.addBuffer(),
            BufferForLine2 : this.addBuffer(),
        };
    } // end of method constructor
    onInit() {
        this.buffers.BufferForLine1
            .setShape(Shape.Line)
            .setColor(Color.OrangeRed)
        ;
        this.buffers.BufferForLine2
            .setShape(Shape.Line)
            .setColor(Color.Khaki)
        ;
    } // end of function onInit

    async onUpdate() {
		  const {PriceType} = this.getInputs(),
		{BufferForLine1, BufferForLine2} = this.buffers,
        {
          Close,
	      Open,
         } = await Bar.load([
                Bar.Mode.Close,
                Bar.Mode.Open,
            ], PriceType),
         barSize = Close.length;

        for (let i = barSize - 1; i >=0; i--) {
            BufferForLine1.set(i, Close[i]);
	BufferForLine2.set(i, Open[i]);
        } //end of cycle
    } // end of onUpdate function
} // end of indicator code
The time has come to ask the user at what type of price points he wants to build lines: ask or bid.
To do this, we add a line to the constructor
this.addInput("PriceType", InputType.PriceType, PriceType.Bid);
(mtrader7.com/ru/docs/Terminal/mScript/JavaScript/v1/mScript/addInput)
and in onUpdate PriceType = 0, replace it with {PriceType} = this.getInputs () - thus reporting to the onUpdate method the data requested from the user
(mtrader7.com/ru/docs/Terminal/mScript/JavaScript/v1/mScript/getInputs).
As a result of such changes when installing the indicator on the chart the user will be offered an already expanded menu:
1.5 Add a little more interactivity, functionality and friendliness
The user may want to draw these two lines not at Close and Open, but at other points. We will give him such an opportunity.
export class Main extends Indicator {
    constructor() {
        super();
		this.addInput("PriceType", InputType.PriceType, PriceType.Bid);
		this.addInput("Line1Price", InputType.AppliedPrice, 0);
		this.addInput("Line2Price", InputType.AppliedPrice, 1);
        this.buffers = {
            BufferForLine1 : this.addBuffer(),
            BufferForLine2 : this.addBuffer(),
        };
    } // end of method constructor
    onInit() {

        this.buffers.BufferForLine1
            .setShape(Shape.Line)
            .setColor(Color.OrangeRed)
           .setLabel("Color, thickness and line style 1")
        ;

        this.buffers.BufferForLine2
            .setShape(Shape.Line)
            .setColor(Color.Khaki)
	 .setLabel("Color, thickness and line style 2")
        ;
    } // end of function onInit

    async onUpdate() {
        const {PriceType, Line1Price, Line2Price} = this.getInputs(),
                 {BufferForLine1, BufferForLine2} = this.buffers,
        {
          Close,
          Open,
          High,
          Low,
         } = await Bar.load([
                Bar.Mode.Close,
                Bar.Mode.Open,
                Bar.Mode.High,
                Bar.Mode.Low,
		     ], PriceType),
         barSize = Close.length;

        for (let i = barSize - 1; i >=0; i--) {
	let Price1, Price2;

	switch (Line1Price) {
              case 0:
                Price1 = Close[i];
                break;
              case 1:
                Price1 = Open[i];
                break;
              case 2:
                Price1 = High[i];
                break;
              case 3:
                Price1 = Low[i];
                break;
              default:
                Price1 = Close[i];
            } // end switch Line1Price

	switch (Line2Price) {
              case 0:
                Price2 = Close[i];
                break;
              case 1:
                Price2 = Open[i];
                break;
              case 2:
                Price2 = High[i];
                break;
              case 3:
                Price2 = Low[i];
                break;
              default:
                Price2 = Close[i];
            } // end switch Line2Price

            BufferForLine1.set(i, Price1);
	BufferForLine2.set(i, Price2);
        } //end of cycle i
    } // end of function onUpdate
} // end of indicator code
We added two queries to the constructor about what values to use for building lines:
this.addInput("Line1Price", InputType.AppliedPrice, 0);
		this.addInput("Line2Price", InputType.AppliedPrice, 1);
Accordingly, we expanded data requests in onUpdate
{PriceType, Line1Price, Line2Price } = this.getInputs()
and
        {
          Close,
          Open,
          High,
          Low,
         } = await Bar.load([
                Bar.Mode.Close,
                Bar.Mode.Open,
                Bar.Mode.High,
                Bar.Mode.Low,
		     ], PriceType)
and reworked the loop code by adding a couple of intermediate variables
let Price1, Price2;
and a couple of switch statements to select the appropriate values for these variables
(developer.mozilla.org/ru/docs/Web/JavaScript/Reference/Statements/switch)
With these values, we now fill in the buffer arrays in the loop:
BufferForLine1.set(i, Price1);
BufferForLine2.set(i, Price2);
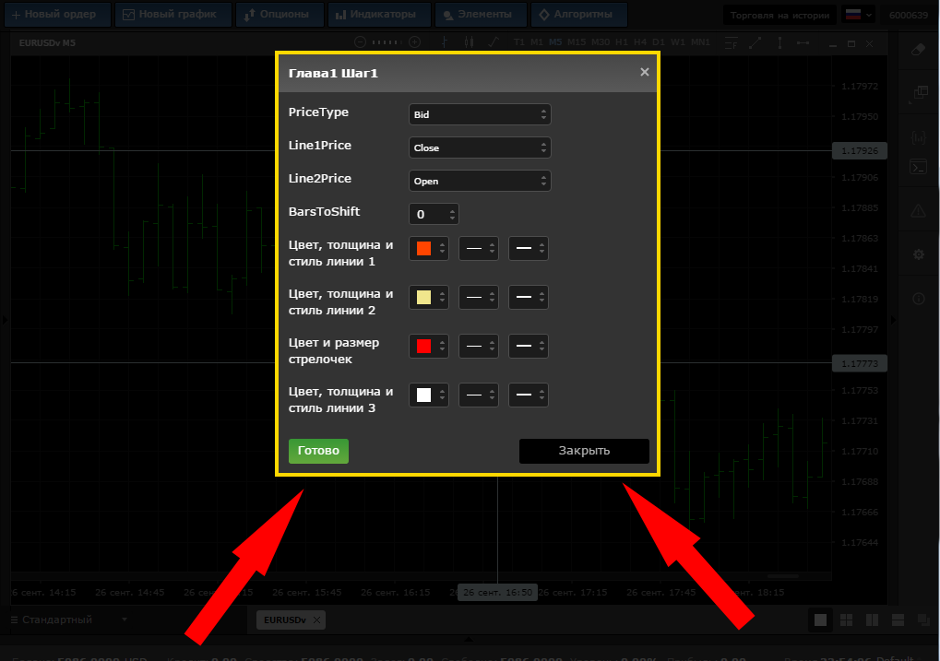
In addition to these functional changes, we’ll add a bit of “friendliness” to the user at the data request stage - we have the opportunity to set a description of the drawn indicators in onInit, which we will use:
.setLabel("Color, thickness and line style 1")
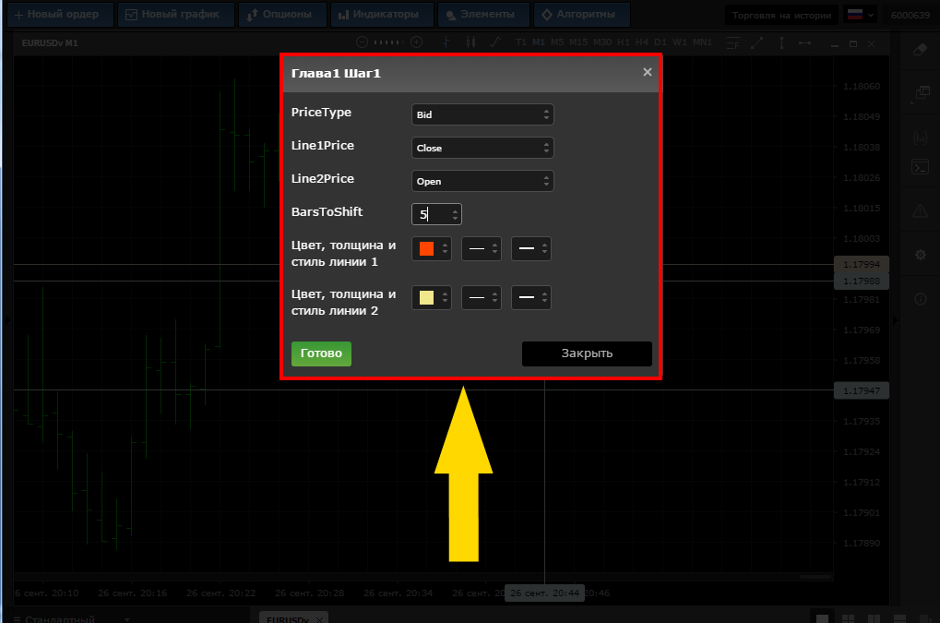
Now the data request window looks a bit prettier:

And the indicator lines can be drawn, for example, through the High and Low points:
1.6 Add the ability to draw lines with a shift of several bars forward or backward
export class Main extends Indicator {
    constructor() {
        super();
		this.addInput("PriceType", InputType.PriceType, PriceType.Bid);
		this.addInput("Line1Price", InputType.AppliedPrice, 0);
		this.addInput("Line2Price", InputType.AppliedPrice, 1);
		this.addInput("BarsToShift", InputType.int, 0);
        this.buffers = {
            BufferForLine1 : this.addBuffer(),
            BufferForLine2 : this.addBuffer(),
        };
    } // end of method constructor
    onInit() {
        this.buffers.BufferForLine1
            .setShape(Shape.Line)
            .setColor(Color.OrangeRed)
           .setLabel("Color, thickness and line style 1")
        ;

        this.buffers.BufferForLine2
            .setShape(Shape.Line)
            .setColor(Color.Khaki)
	 .setLabel("Color, thickness and line style 2")
        ;

    } // end of function onInit

    async onUpdate() {
		  const {PriceType, Line1Price, Line2Price, BarsToShift} = this.getInputs(),
		{BufferForLine1, BufferForLine2} = this.buffers,
        {
          Close,
	      Open,
		  High,
          Low,
         } = await Bar.load([
                Bar.Mode.Close,
                Bar.Mode.Open,
                Bar.Mode.High,
                Bar.Mode.Low,
		     ], PriceType),
         barSize = Close.length;
        for (let i = barSize - 1; i >=0; i--) {
	let Price1, Price2;
	switch (Line1Price) {
              case 0:
                Price1 = Close[i+BarsToShift];
                break;
              case 1:
                Price1 = Open[i+BarsToShift];
                break;
              case 2:
                Price1 = High[i+BarsToShift];
                break;
              case 3:
                Price1 = Low[i+BarsToShift];
                break;
              default:
                Price1 = Close[i+BarsToShift];
            } // end switch Line1Price

	switch (Line2Price) {
              case 0:
                Price2 = Close[i+BarsToShift];
                break;
              case 1:
                Price2 = Open[i+BarsToShift];
                break;
              case 2:
                Price2 = High[i+BarsToShift];
                break;

            case 3:
                Price2 = Low[i+BarsToShift];
                break;
              default:
                Price2 = Close[i+BarsToShift];
            } // end switch Line2Price
            BufferForLine1.set(i, Price1);
	BufferForLine2.set(i, Price2);
        } //end of cycle i
    } // end of onUpdate function
} // end of indicator code
We added one more request to the constructor - the number of shift bars:
this.addInput("BarsToShift", InputType.int, 0);
and in onUpdate expanded the request for receiving input data:
{PriceType, Line1Price, Line2Price, BarsToShift} = this.getInputs()
and added shift processing in the loop, replacing the corresponding assignment operators for intermediate variables in all lines of the switch statements, for example
Price1 = Close[i]; на Price1 = Close[i+BarsToShift];
Now the user preference request window has changed again:
and the indicator lines on the chart can be shifted forward,
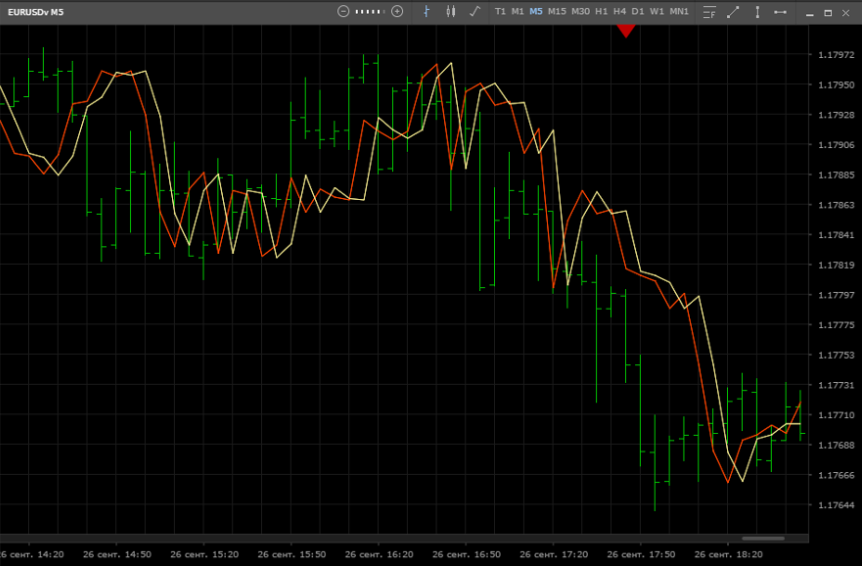
so back.

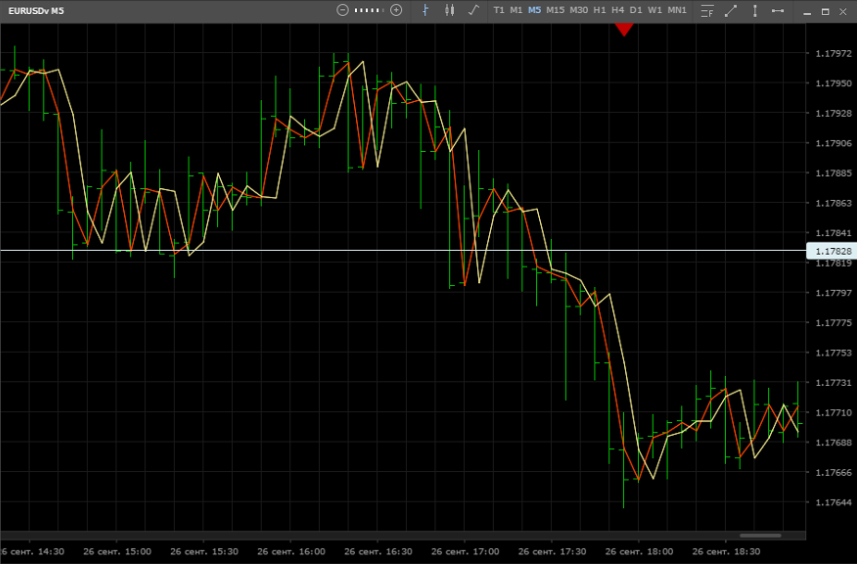
Compared to the original line layout without offset:
1.7 Add arrows to the chart
To illustrate the possibilities of drawing arrows, we restrict ourselves to a simple task so far: draw arrows at the High level of each bar.
export class Main extends Indicator {
    constructor() {
        super();
		this.addInput("PriceType", InputType.PriceType, PriceType.Bid);
		this.addInput("Line1Price", InputType.AppliedPrice, 0);
		this.addInput("Line2Price", InputType.AppliedPrice, 1);
		this.addInput("BarsToShift", InputType.int, 0);
        this.buffers = {
            BufferForLine1 : this.addBuffer(),
            BufferForLine2 : this.addBuffer(),
            BufferForArrows1 : this.addBuffer(),
        };
    } // end of method constructor
    onInit() {
        this.buffers.BufferForLine1
            .setShape(Shape.Line)
            .setColor(Color.OrangeRed)
		    .setLabel("Color, thickness and line style 1")
        ;

        this.buffers.BufferForLine2
            .setShape(Shape.Line)
            .setColor(Color.Khaki)
		    .setLabel("Color, thickness and line style 2")
        ;

        this.buffers.BufferForArrows1
            .setShape(Shape.Arrow)
            .setArrow(ArrowSymbols.ArrowDoubleUpWards)
            .setColor(Color.Red)
            .setLabel("Color and size of arrows")
      ;


    } // end of function onInit
    async onUpdate() {
		  const {PriceType, Line1Price, Line2Price, BarsToShift} = this.getInputs(),
		{BufferForLine1, BufferForLine2, BufferForArrows1} = this.buffers,
        {
         Close,
         Open,
         High,
          Low,
         } = await Bar.load([
                Bar.Mode.Close,
                Bar.Mode.Open,
                Bar.Mode.High,
                Bar.Mode.Low,
		     ], PriceType),
         barSize = Close.length;

        for (let i = barSize - 1; i >=0; i--) {
			let Price1, Price2;

	switch (Line1Price) {
              case 0:
                Price1 = Close[i+BarsToShift];
                break;
              case 1:
                Price1 = Open[i+BarsToShift];
                break;
              case 2:
                Price1 = High[i+BarsToShift];
                break;
              case 3:
                Price1 = Low[i+BarsToShift];
                break;
              default:
                Price1 = Close[i+BarsToShift];
            } // end switch Line1Price


	switch (Line2Price) {
              case 0:
                Price2 = Close[i+BarsToShift];
                break;
              case 1:
                Price2 = Open[i+BarsToShift];
                break;
              case 2:
                Price2 = High[i+BarsToShift];
                break;
              case 3:
                Price2 = Low[i+BarsToShift];
                break;
              default:
                Price2 = Close[i+BarsToShift];
            } // end switch Line2Price

            BufferForLine1.set(i, Price1);
			BufferForLine2.set(i, Price2);
			BufferForArrows1.set(i, High[i] + 2 * Current.Point);
        } //end of cycle i
	BufferForArrows1.clear(0,1);
    } // end of onUpdate function
} // end of indicator code
There are not too many changes in the code of our indicator:
- we added one more buffer to constructor
BufferForArrows1: this.addBuffer ()
- in onInit added initialization of this new buffer:
  this.buffers.BufferForArrows1
   .setShape(Shape.Arrow)
     .setArrow(ArrowSymbols.ArrowDoubleUpWards)
     .setColor(Color.Red)
      .setLabel("Color and size of arrows")
      ;
- in onUpdate added a new buffer to the data request list
{BufferForLine1, BufferForLine2, BufferForArrows1} = this.buffers
and in the body of the loop we organized the filling of a new buffer with data:
BufferForArrows1.set(i, High[i] + 2 * Current.Point);
We add a small shift of the arrow position up (High [i] + 2 * Current.Point), since by default the center of the arrow falls on the point of the set buffer value and it looks not very readable on the chart.
In addition, already at the end of the cycle, we remove the arrow from the last bar:
BufferForArrows1.clear(0,1);
since we want to have no redrawing indicator, and the final High value of the last bar has not yet been set.
As a result of all changes, the query window and indicator display changed again:

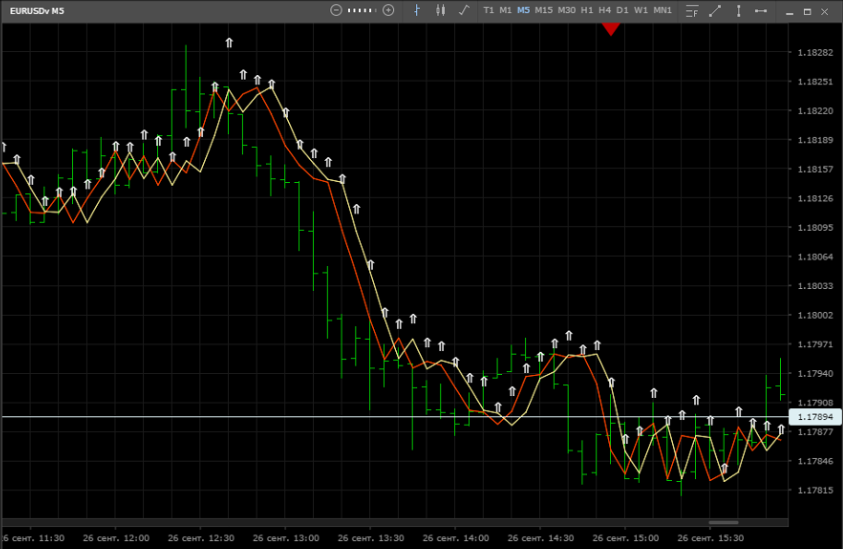
1.8 Let's give arrows some sense
We will draw arrows not for each bar in a row, but only for those where the High value is greater than the previous bar.
export class Main extends Indicator {
    constructor() {
        super();
	this.addInput("PriceType", InputType.PriceType, PriceType.Bid);
	this.addInput("Line1Price", InputType.AppliedPrice, 0);
	this.addInput("Line2Price", InputType.AppliedPrice, 1);
	this.addInput("BarsToShift", InputType.int, 0);
        this.buffers = {
            BufferForLine1 : this.addBuffer(),
            BufferForLine2 : this.addBuffer(),
            BufferForArrows1 : this.addBuffer(),
        };
    } // end of method constructor
    onInit() {
        this.buffers.BufferForLine1
            .setShape(Shape.Line)
            .setColor(Color.OrangeRed)
		    .setLabel("Color, thickness and line style 1")
        ;
        this.buffers.BufferForLine2
            .setShape(Shape.Line)
            .setColor(Color.Khaki)
		    .setLabel("Color, thickness and line style 2")
        ;
        this.buffers.BufferForArrows1
            .setShape(Shape.Arrow)
            .setArrow(ArrowSymbols.ArrowDoubleUpWards)
            .setColor(Color.Red)
            .setLabel("Color and size of arrows")
      ;
    } // end of function onInit
    async onUpdate() {
		  const {PriceType, Line1Price, Line2Price, BarsToShift} = this.getInputs(),
		{BufferForLine1, BufferForLine2, BufferForArrows1} = this.buffers,
        {
          Close,
          Open,
          High,
          Low,
         } = await Bar.load([
                Bar.Mode.Close,
                Bar.Mode.Open,
                Bar.Mode.High,
                Bar.Mode.Low,
		     ], PriceType),
         barSize = Close.length;
        for (let i = barSize - 1; i >=0; i--) {
           let Price1, Price2;
	switch (Line1Price) {
              case 0:
                Price1 = Close[i+BarsToShift];
                break;
              case 1:
                Price1 = Open[i+BarsToShift];
                break;
              case 2:
                Price1 = High[i+BarsToShift];
                break;
              case 3:
                Price1 = Low[i+BarsToShift];
                break;
              default:
                Price1 = Close[i+BarsToShift];
            } // end switch Line1Price

	switch (Line2Price) {
              case 0:
                Price2 = Close[i+BarsToShift];
                break;
              case 1:
                Price2 = Open[i+BarsToShift];
                break;

              case 2:
                Price2 = High[i+BarsToShift];
                break;
              case 3:
                Price2 = Low[i+BarsToShift];
                break;
              default:
                Price2 = Close[i+BarsToShift];
            } // end switch Line2Price

            BufferForLine1.set(i, Price1);
	BufferForLine2.set(i, Price2);
	if ( i < barSize - 1 &&  High[i] > High[i+1] ) {
              BufferForArrows1.set(i, High[i] + 2 * Current.Point);
	} else {
              BufferForArrows1.clear(i,i+1);
	}
        } //end of cycle i
       BufferForArrows1.clear(0,1);
    } // end of onUpdate function
} // end of indicator code
There are very few changes in the code: we just replaced the unconditional drawing of arrows in the loop body with the conditional operator(developer.mozilla.org/ru/docs/Web/JavaScript/Reference/Statements/if...else):
if ( i < barSize - 1 &&  High[i] > High[i+1] ) {
              BufferForArrows1.set(i, High[i] + 2 * Current.Point);
} else {
             BufferForArrows1.clear(i,i+1);
}
This allows you to achieve the desired result:

1.9 Add another line
Connect the High points where the arrows are drawn with another line.
export class Main extends Indicator {
    constructor() {
        super();
        this.setProperty(Property.ShortName, "Custom Indicator - Example");
	this.addInput("PriceType", InputType.PriceType, PriceType.Bid);
	this.addInput("Line1Price", InputType.AppliedPrice, 0);
	this.addInput("Line2Price", InputType.AppliedPrice, 1);
	this.addInput("BarsToShift", InputType.int, 0);

        this.buffers = {
            BufferForLine1 : this.addBuffer(),
            BufferForLine2 : this.addBuffer(),
            BufferForArrows1 : this.addBuffer(),
	BufferForLine3 : this.addBuffer(),
        };
    } // end of method constructor

    onInit() {
        this.buffers.BufferForLine1
            .setShape(Shape.Line)
            .setColor(Color.OrangeRed)
           .setLabel("Color, thickness and line style 1")
        ;

        this.buffers.BufferForLine2
            .setShape(Shape.Line)
            .setColor(Color.Khaki)
	.setLabel("Color, thickness and line style 2")
        ;
        this.buffers.BufferForArrows1
            .setShape(Shape.Arrow)
            .setArrow(ArrowSymbols.ArrowDoubleUpWards)
            .setColor(Color.Red)
	 .setLabel("Color and size of arrows")
       ;
       this.buffers.BufferForLine3
            .setShape(Shape.Line)
            .setColor(Color.White)
	 .setLabel("Color, thickness and line style 3")
        ;
    } // end of function onInit

    async onUpdate() {
	const {PriceType, Line1Price, Line2Price, BarsToShift} = this.getInputs(),
	{BufferForLine1, BufferForLine2, BufferForArrows1,BufferForLine3} = this.buffers,
        {
          Close,
          Open,
          High,
          Low,
         } = await Bar.load([
                Bar.Mode.Close,
                Bar.Mode.Open,
                Bar.Mode.High,
                Bar.Mode.Low,
		     ], PriceType),
         barSize = Close.length;

        var CurrentHighest;

        for (let i = barSize - 1; i >=0; i--) {
	let Price1, Price2;
	switch (Line1Price) {
              case 0:
                Price1 = Close[i+BarsToShift];
                break;
              case 1:
                Price1 = Open[i+BarsToShift];
                break;
              case 2:
                Price1 = High[i+BarsToShift];
                break;
              case 3:
                Price1 = Low[i+BarsToShift];
                break;
              default:
                Price1 = Close[i+BarsToShift];
            } // end switch Line1Price

	switch (Line2Price) {
              case 0:
                Price2 = Close[i+BarsToShift];
                break;
              case 1:
                Price2 = Open[i+BarsToShift];
                break;
              case 2:
                Price2 = High[i+BarsToShift];
                break;
              case 3:
                Price2 = Low[i+BarsToShift];
                break;
              default:
                Price2 = Close[i+BarsToShift];
            } // end switch Line2Price

            BufferForLine1.set(i, Price1);
	BufferForLine2.set(i, Price2);
	if ( i < barSize - 1 &&  High[i] > High[i+1] ) {
              BufferForArrows1.set(i, High[i] + 2 * Current.Point);
	  BufferForLine3.set(i, High[i]);
	  CurrentHighest = High[i];
	} else {
              BufferForArrows1.clear(i,i+1);
			  BufferForLine3.set(i, CurrentHighest);
	} // end if
        } //end of cycle i
	BufferForArrows1.clear(0,1);
	BufferForLine3.clear(0,1);
    } // end of onUpdate function
} // end of indicator code
As an attentive reader can easily guess, we:
- added another buffer to constructor:
BufferForLine3 : this.addBuffer()
- added its initialization to onInit:
       this.buffers.BufferForLine3
            .setShape(Shape.Line)
            .setColor(Color.White)
	.setLabel("Color, thickness and line style 3")
        ;
- in onUpdate added this new buffer to the data request
{BufferForLine1, BufferForLine2, BufferForArrows1,BufferForLine3} = this.buffers
and in the loop body filling a new buffer with data:
if ( i < barSize - 1 &&  High[i] > High[i+1] ) {
              BufferForArrows1.set(i, High[i] + 2 * Current.Point);
	  BufferForLine3.set(i, High[i]);
	  CurrentHighest = High[i];
} else {
              BufferForArrows1.clear(i,i+1);
	  BufferForLine3.set(i, CurrentHighest);
} // end if
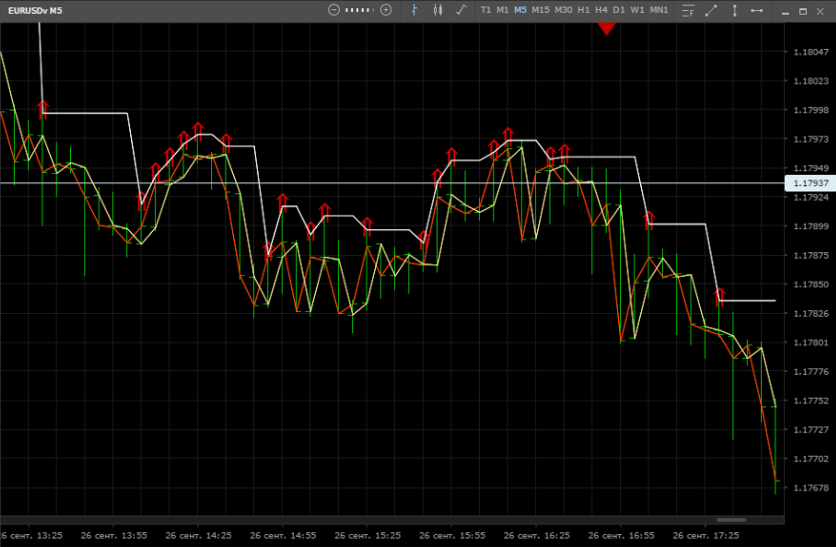
Please note that we finally gave a name to our indicator by adding the declaration of one of the indicator properties to the constructor:
this.setProperty (Property.ShortName, "Custom Indicator - Example");
(mtrader7.com/ru/docs/Terminal/mScript/JavaScript/v1/mScript/setProperty)
(mtrader7.com/ru/docs/Terminal/mScript/JavaScript/v1/Property)
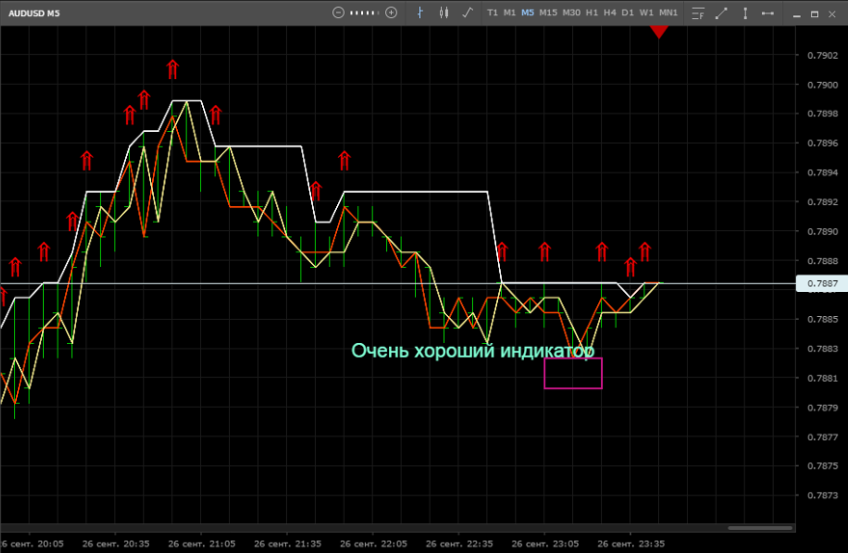
1.10 Graphic Elements: Text and Rectangle
Let's look at a couple of examples of working with graphic objects.
export class Main extends Indicator {
    constructor() {
        super();
        this.setProperty(Property.ShortName, "Custom Indicator - Example");
	this.addInput("PriceType", InputType.PriceType, PriceType.Bid);
	this.addInput("Line1Price", InputType.AppliedPrice, 0);
	this.addInput("Line2Price", InputType.AppliedPrice, 1);
	this.addInput("BarsToShift", InputType.int, 0);
        this.buffers = {
            BufferForLine1 : this.addBuffer(),
            BufferForLine2 : this.addBuffer(),
            BufferForArrows1 : this.addBuffer(),
	BufferForLine3 : this.addBuffer(),
        };
    } // end of method constructor
    onInit() {
        this.buffers.BufferForLine1
            .setShape(Shape.Line)
            .setColor(Color.OrangeRed)
           .setLabel("Color, thickness and line style 1")
        ;


        this.buffers.BufferForLine2
            .setShape(Shape.Line)
            .setColor(Color.Khaki)
	.setLabel("Color, thickness and line style 2")
        ;

        this.buffers.BufferForArrows1
            .setShape(Shape.Arrow)
            .setArrow(ArrowSymbols.ArrowDoubleUpWards)
            .setColor(Color.Red)
	 .setLabel("Color and size of arrows")
       ;
       this.buffers.BufferForLine3
            .setShape(Shape.Line)
            .setColor(Color.White)
	.setLabel("Color, thickness and line style 3")
        ;
    } // end of function onInit

    async onUpdate() {
      const {PriceType, Line1Price, Line2Price, BarsToShift} = this.getInputs(),
     {BufferForLine1, BufferForLine2, BufferForArrows1,BufferForLine3} = this.buffers,
   {
          Close,
          Open,
          High,
          Low,
          Time,
         } = await Bar.load([
                Bar.Mode.Close,
                Bar.Mode.Open,
                Bar.Mode.High,
                Bar.Mode.Low,
	    Bar.Mode.Time,
	     ], PriceType),
         barSize = Close.length;
// Объект "Текст"
let TextObjectName = "MyTextObject";
let OurTextObject = this.getObject(TextObjectName);
if (!OurTextObject) {
OurTextObject = this.createObject(GObject.Type.Text, TextObjectName)
	.setTime1(Time[12])
	.setPrice1(Low[12] - 1 * Current.Point)
	.setColor(Color.Aquamarine)
	.setText("Very good indicator")
	.setFontSize("22")
}
// End of Object "Text"
// An object "Rectangle"
let RectangleObjectName = "MyRectangleObject";
let OurRectangleObject = this.getObject(RectangleObjectName);
if (!OurRectangleObject) {
OurRectangleObject = this.createObject(GObject.Type.Rectangle, RectangleObjectName)
  .setTime1(Time[7])
  .setPrice1(Low[7] -2 * Current.Point)
  .setTime2(Time[3])
  .setPrice2(Low[3] - 4 * Current.Point)
  .setColor(Color.MediumVioletRed)
}
// End of Object "Rectangle"
        var CurrentHighest;
        for (let i = barSize - 1; i >=0; i--) {
	let Price1, Price2;
	switch (Line1Price) {
              case 0:
                Price1 = Close[i+BarsToShift];
                break;
              case 1:
                Price1 = Open[i+BarsToShift];
                break;
              case 2:
                Price1 = High[i+BarsToShift];
                break;
              case 3:
                Price1 = Low[i+BarsToShift];
                break;
              default:
                Price1 = Close[i+BarsToShift];
            } // end switch Line1Price

	switch (Line2Price) {
              case 0:
                Price2 = Close[i+BarsToShift];
                break;
              case 1:
                Price2 = Open[i+BarsToShift];
                break;
              case 2:
                Price2 = High[i+BarsToShift];
                break;
              case 3:
                Price2 = Low[i+BarsToShift];
                break;
              default:
                Price2 = Close[i+BarsToShift];
            } // end switch Line2Price
            BufferForLine1.set(i, Price1);
	BufferForLine2.set(i, Price2);
	if ( i < barSize - 1 &&  High[i] > High[i+1] ) {
              BufferForArrows1.set(i, High[i] + 2 * Current.Point);
			  BufferForLine3.set(i, High[i]);
			  CurrentHighest = High[i];
	} else {
              BufferForArrows1.clear(i,i+1);
			  BufferForLine3.set(i, CurrentHighest);
	} // end if
        } //end cycle on i
       BufferForArrows1.clear(0,1);
       BufferForLine3.clear(0,1);
    } // end of onUpdate function
} // end of indicator code
We will need additional data - the Time array, which sets the time of each bar, so we will improve the data request:
   {
          Close,
          Open,
          High,
          Low,
          Time,
         } = await Bar.load([
                Bar.Mode.Close,
                Bar.Mode.Open,
                Bar.Mode.High,
                Bar.Mode.Low,
	    Bar.Mode.Time,
	     ], PriceType)
The following code fragment is responsible for creating an object of type Text:
// An object "Text"
let TextObjectName = "MyTextObject";
let OurTextObject = this.getObject(TextObjectName);
if (!OurTextObject) {
OurTextObject = this.createObject(GObject.Type.Text, TextObjectName)
.setTime1(Time[12])
	.setPrice1(Low[12] - 1 * Current.Point)
	.setColor(Color.Aquamarine)
	.setText("Very good indicator")
	.setFontSize("22")
}
// End of Object "Text"
The sequence of actions is quite simple:
- declare a variable with the name TextObjectName and assign it a value - the name of our text object:
let TextObjectName = "MyTextObject";
- check if such an object already exists:
let OurTextObject = this.getObject(TextObjectName);
- if not, then create a new object:
OurTextObject = this.createObject(GObject.Type.Text, TextObjectName)
and set its characteristics
- starting anchor point of the text:
.setPrice1(Low[12] - 1 * Current.Point)
- color:
.setColor(Color.Aquamarine)
- default text:
.setText("Very good indicator")
- font size:
.setFontSize("22")
Drawing a rectangle produces the following code fragment:
// Объект "Rectangle"
let RectangleObjectName = "MyRectangleObject";
let OurRectangleObject = this.getObject(RectangleObjectName);
if (!OurRectangleObject) {
OurRectangleObject = this.createObject(GObject.Type.Rectangle, RectangleObjectName)
.setTime1(Time[7])
	.setPrice1(Low[7] -2 * Current.Point)
	.setTime2(Time[3])
	.setPrice2(Low[3] - 4 * Current.Point)
	.setColor(Color.MediumVioletRed)
}
// End of Object "Rectangle"
In this case, everything is similar: we set the name of the object and check if it already exists. If not, create a new object and set its parameters. For a rectangle, these are, in addition to color, two more points, the coordinates of the two corners of the rectangle:
.setTime1(Time[7])
	.setPrice1(Low[7] -2 * Current.Point)
and
.setTime2(Time[3])
	.setPrice2(Low[3] - 4 * Current.Point)
This concludes the first part of our story about creating custom indicators.