Graphic elements
The Graphic Elements tab of the Mobius Trader 7 terminal allows you to add various graphic objects to the price chart.
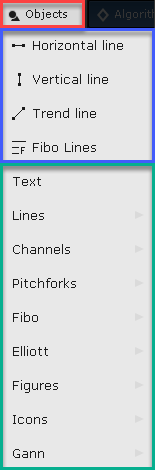
The most popular and often used by traders objects are located immediately below the main tab and are marked with a blue rectangle in the figure. These include:
Horizontal line
Vertical line
Trend line
Fibonacci lines
The remaining graphic objects are divided into special categories, which are highlighted in the figure by a green rectangle:
Lines
Channels
Pitchfork
Fibonacci
Elliott
Figures
Badges
We wish you success in trading!