
 Russian
  中文
中文  العربي
  Bahasa Indonesia
 Graphic elements
In order to add graphic elements to the price chart in the Mobius Trader 7 terminal for Android, you need to go to the Chart tab
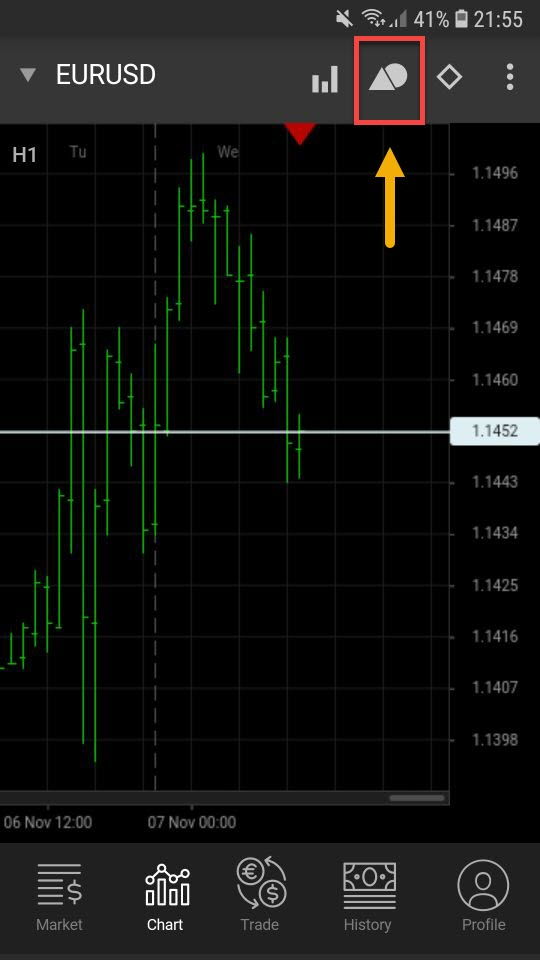
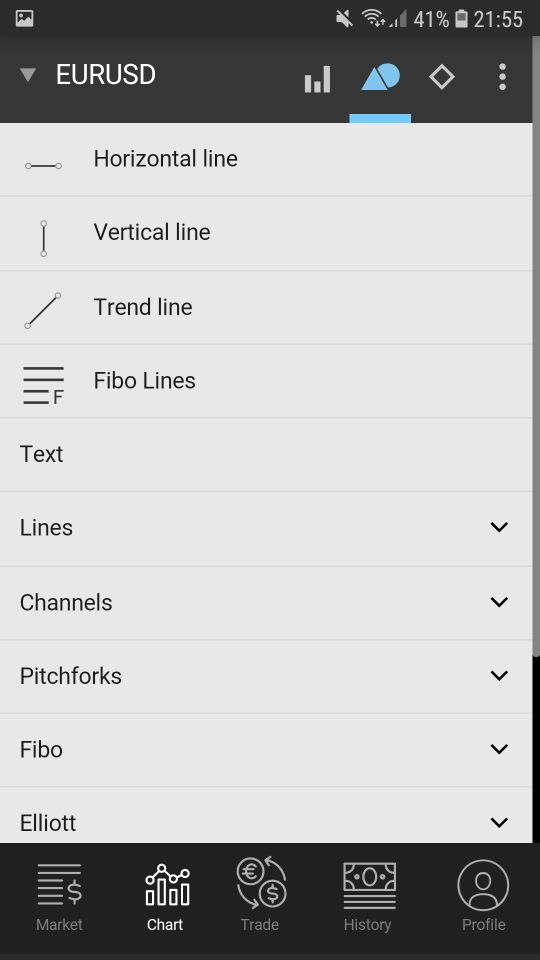
After that, you need to click on the tab for opening graphic elements at the top of the terminal.
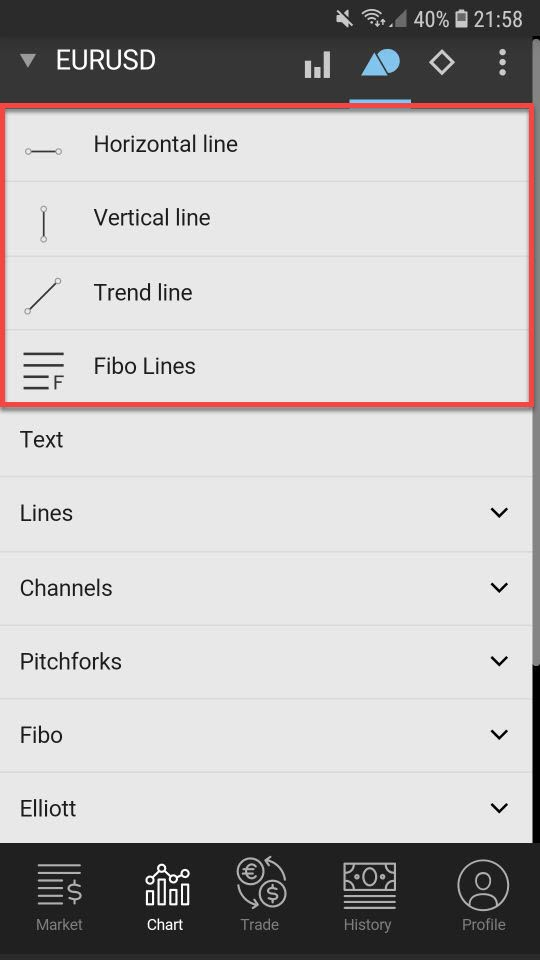
The most popular and often used by traders objects are located immediately below the main tab and are marked with a red rectangle in the figure. These include:
Horizontal line
Vertical line
Trend line
Fibonacci lines
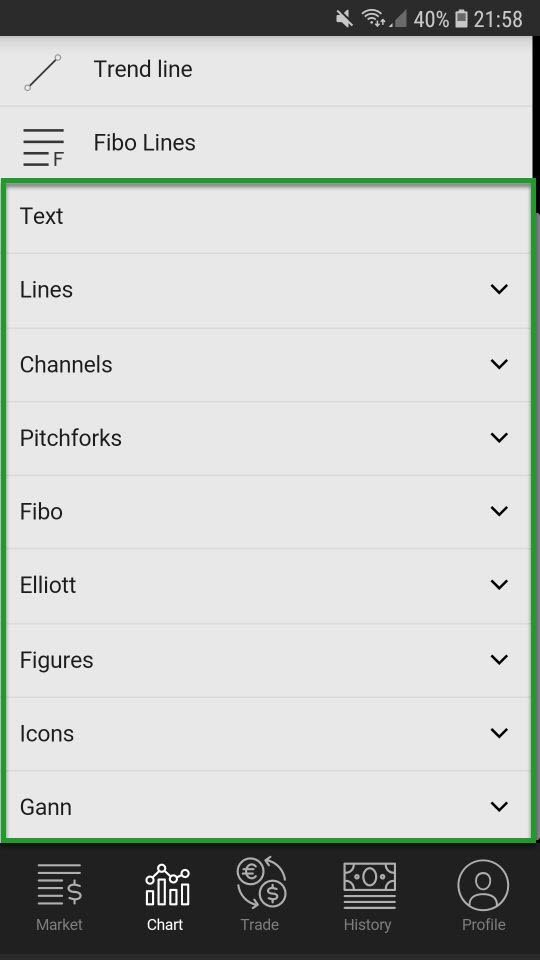
The remaining graphic objects are divided into special categories, which are highlighted in the figure by a green rectangle:
Lines
Channels
Pitchfork
Fibonacci
Elliott
Figures
Badges
We wish you success in trading!