
 Russian
  中文
中文  العربي
  Bahasa Indonesia
 Fibo Lines
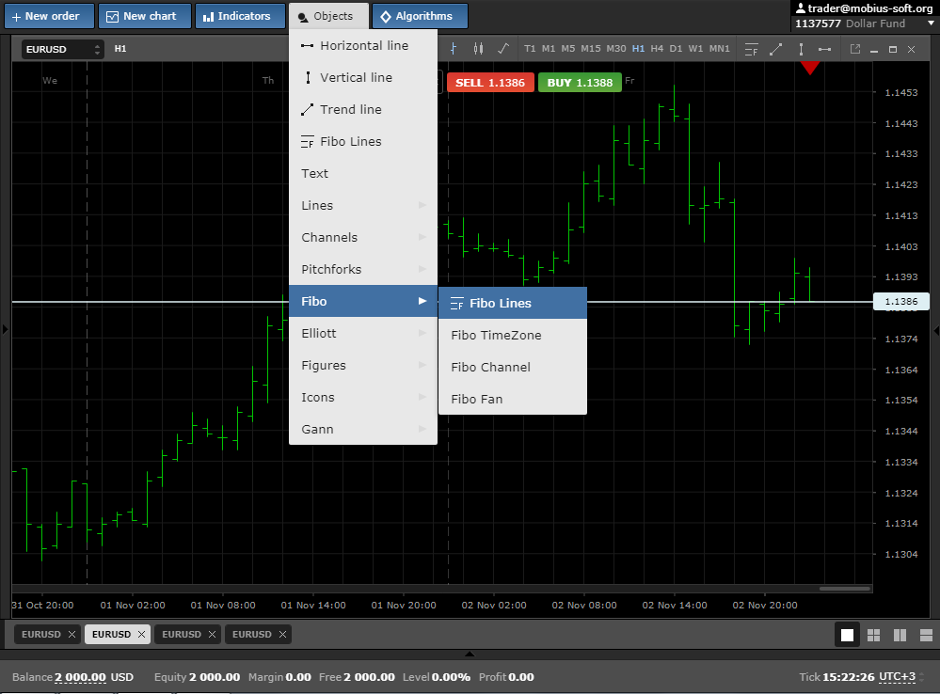
In this overview we will tell you about the most popular Fibo tool – Fibo Lines. To set them on the price it is necessary to choose Objects - Fibo - "Fibo Lines", as shown at the pic below.
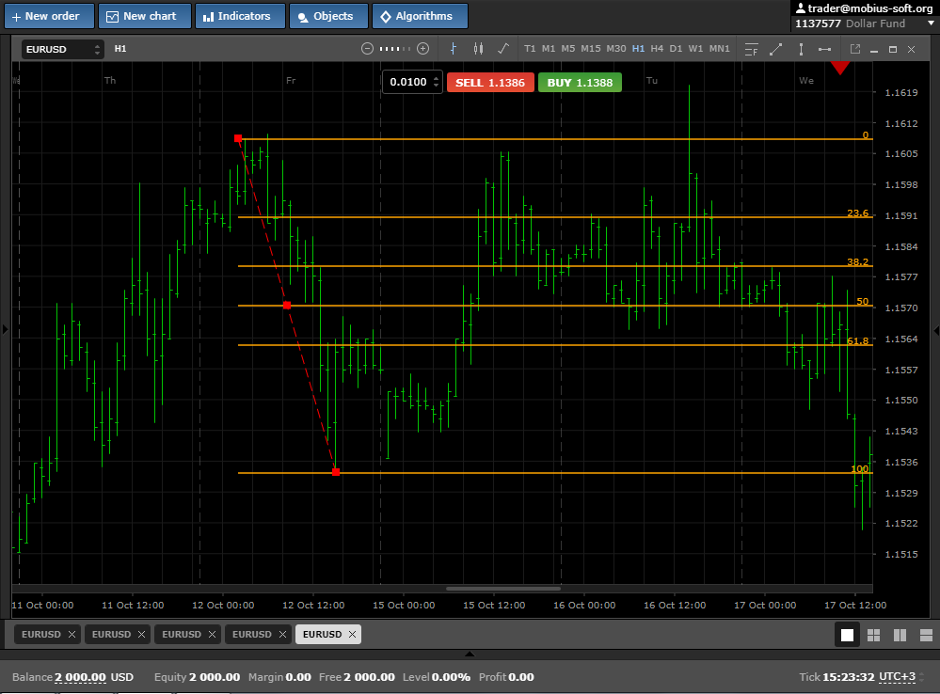
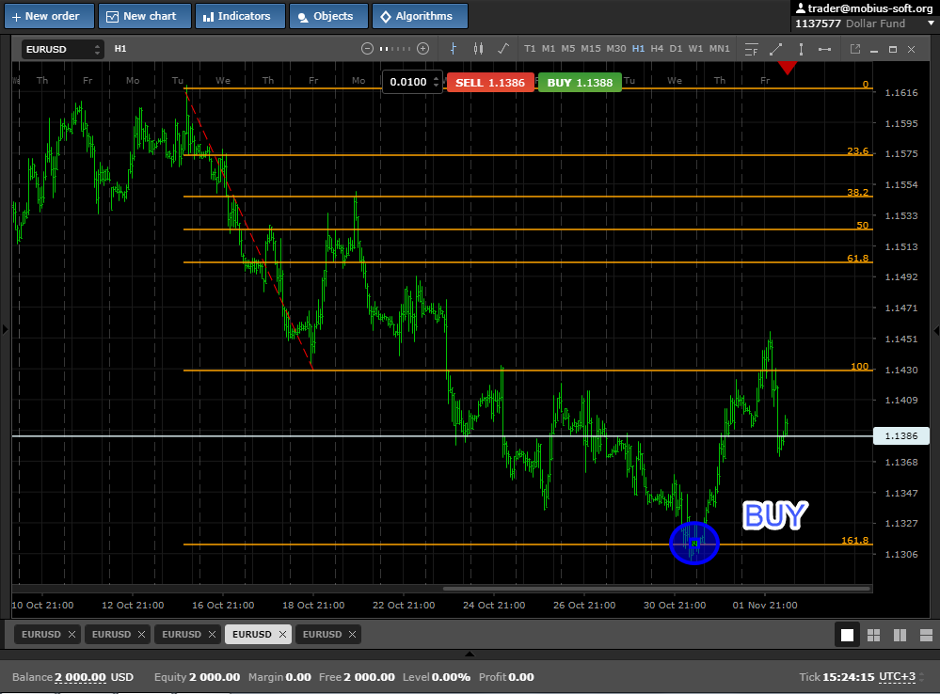
It is possible to use a Fibo grid both for trade in flat and for trade during a trend. If you see that in the market is a flat that it is necessary to pull a grid from a minimum (point 0) to a maximum (point 100).
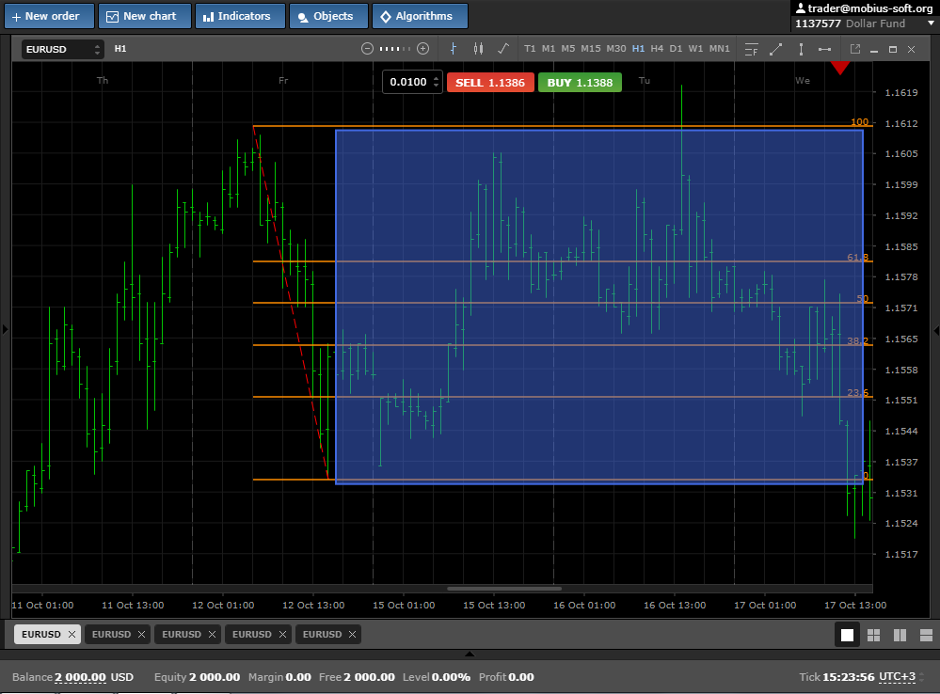
For descriptive reasons we will paint over the price which we don't see during creation of a grid on a flat, we will paint over in blue color
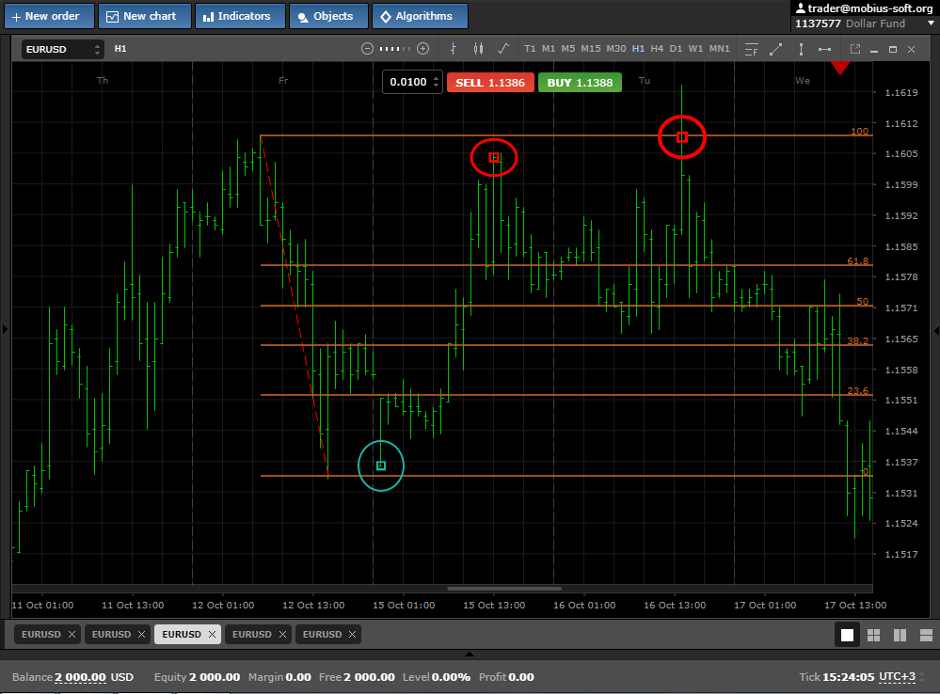
Also we will open the transaction during each touch of the price to border of a flat which are strong lines of support and resistance. At the pic it is possible to see that each point would make for us profit.
During a trend it is possible to allocate from 0 to 100 flat or a small movement of the price and to trade on a release from lines 161,8 261,8 and 423,6. The price from these levels can, both to turn, and to make small kickback and to go further. Therefore it is necessary to be ready to close even small profit.
You can use Fibonacci's grid in the strategy or apply in your own way. We wish you profit
This graphical element can be discussed at forum