
 Russian
  中文
中文  العربي
  Bahasa Indonesia
 Linear regression
To set a linear regression at the price chart it is necessary to choose the tab Objects - "Lines" - "Regression Line", as shown at the pic. below
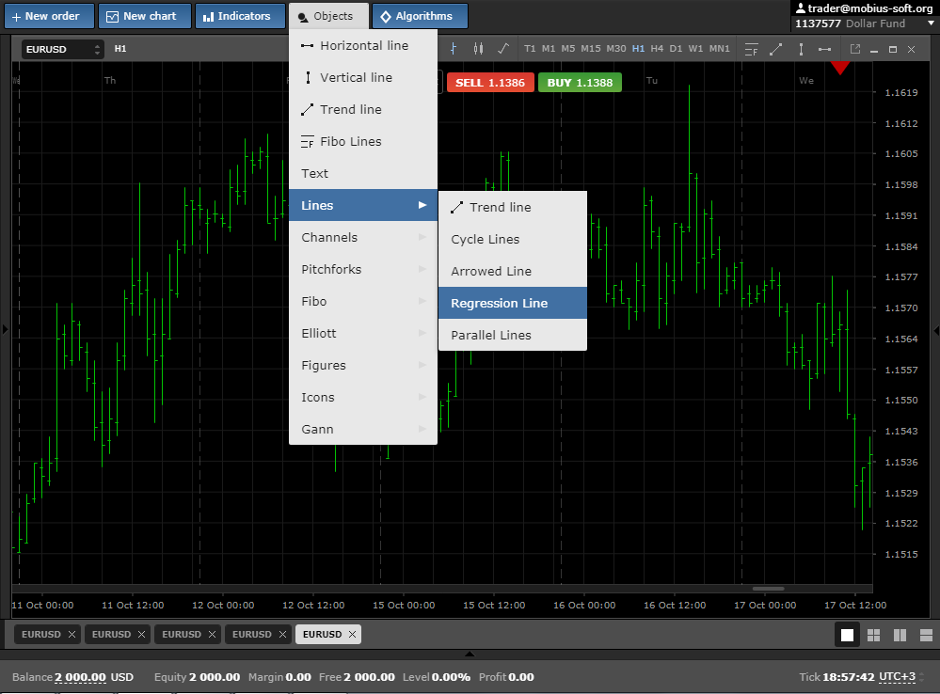
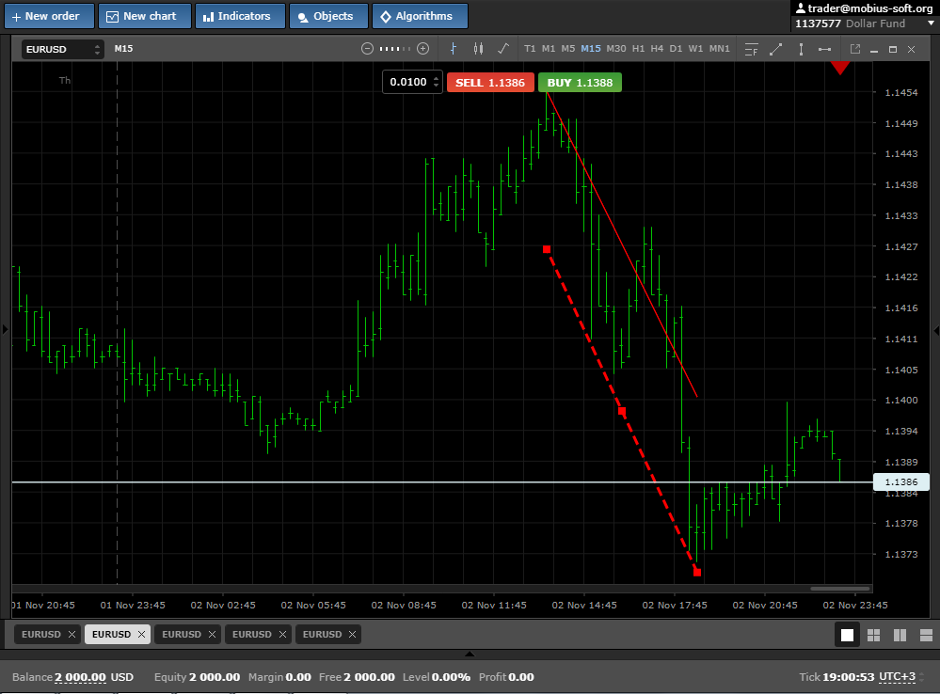
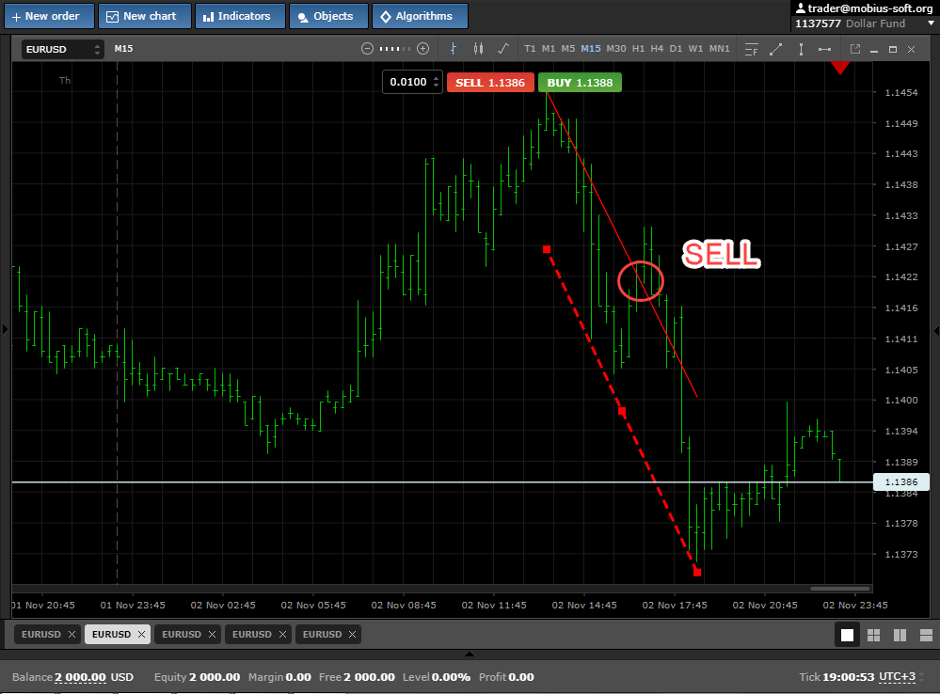
Now it is necessary to choose two points on which will be drawn a dashed trend line and with it at the same time at the opening prices will be the second line - border of the channel. For the ascending trend it will be below the trend line, and for descending - above.
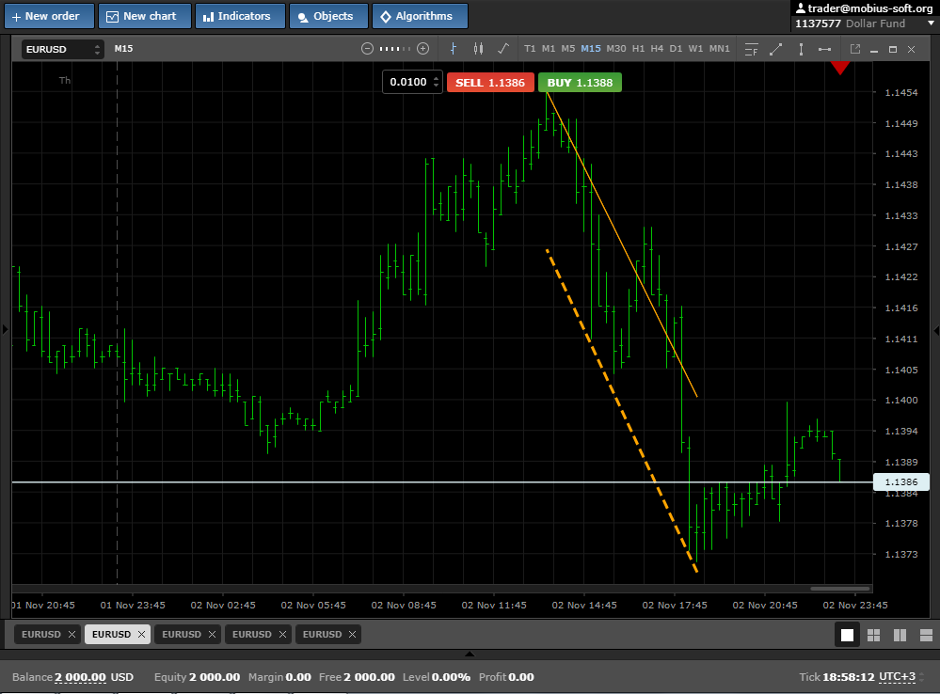
It is possible to specify color and thickness of lines in properties,
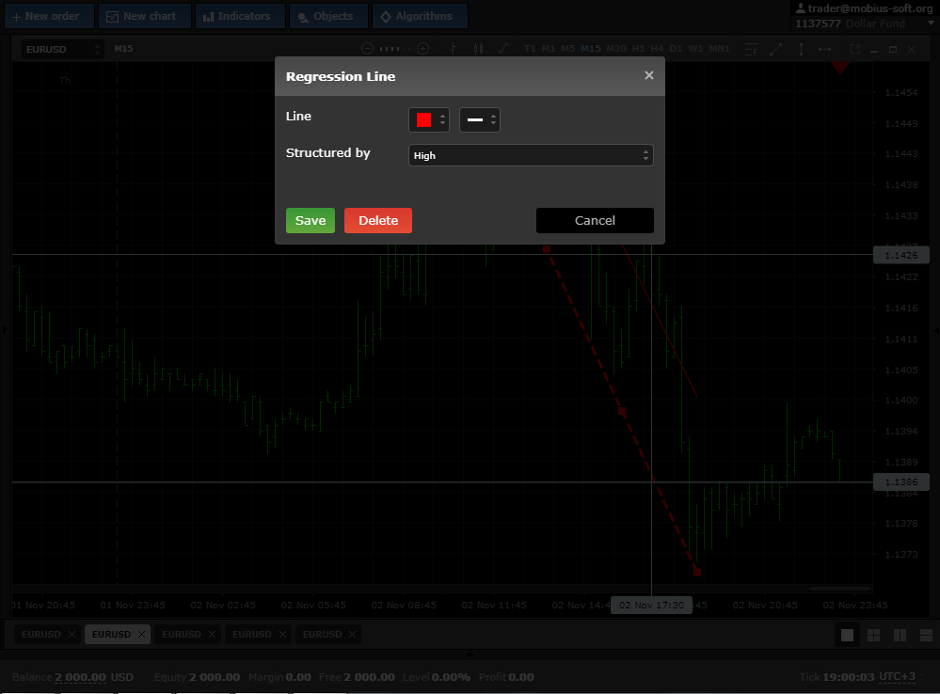
and also it is possible to choose at what prices will be built the construction of the line of resistance for a trend down and the line of support for a trend up.
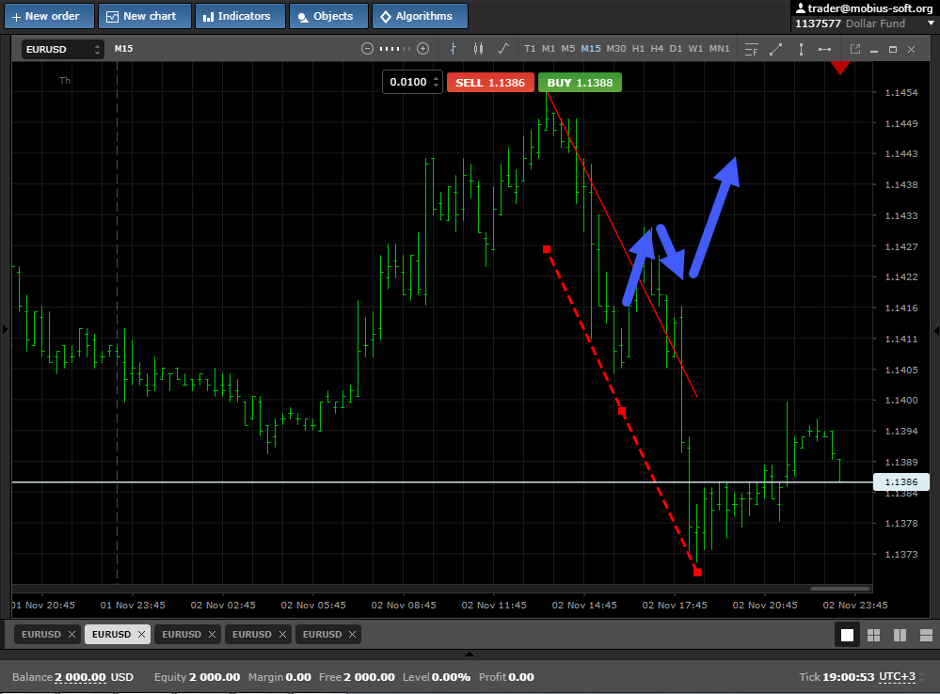
In trade linear regression can be used as on a release from the line of support of resistance,
And on breakdown and an entrance on fixing of the price higher than the channel.
We wish you high profit.
This graphical element can be discussed at forum