
 Russian
  中文
中文  العربي
  Bahasa Indonesia
 Rectangle
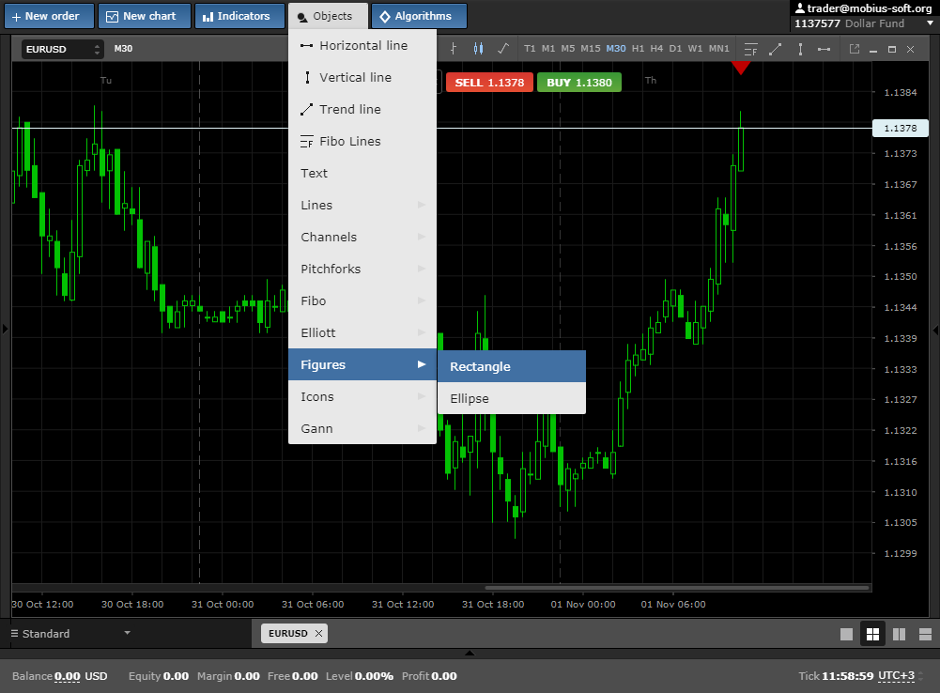
We present to your attention a very useful element of the graphical analysis for a price chart – rectangle.
To set it, it is necessary to choose "Objects" - "Figures" - "Rectangle".
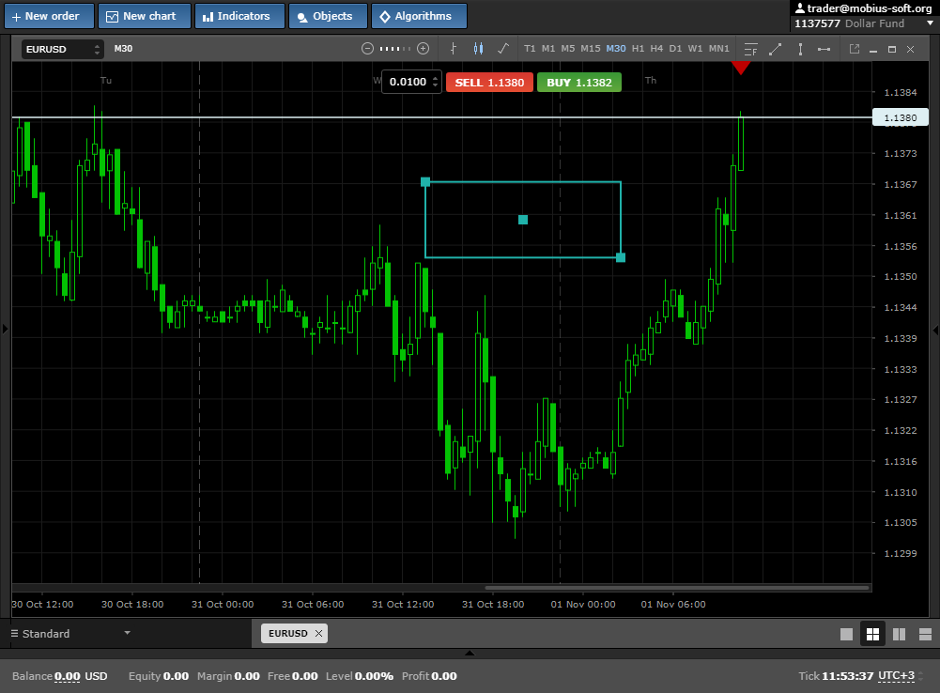
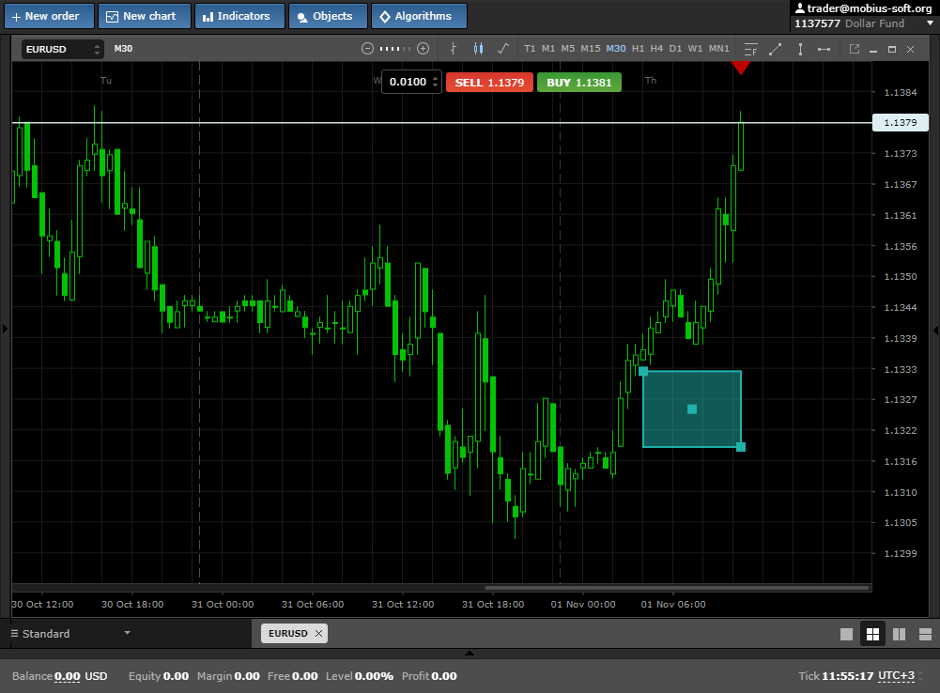
After that you should click the left button of a mouse at any place at a graphics and to stretch a rectangle to the necessary size.
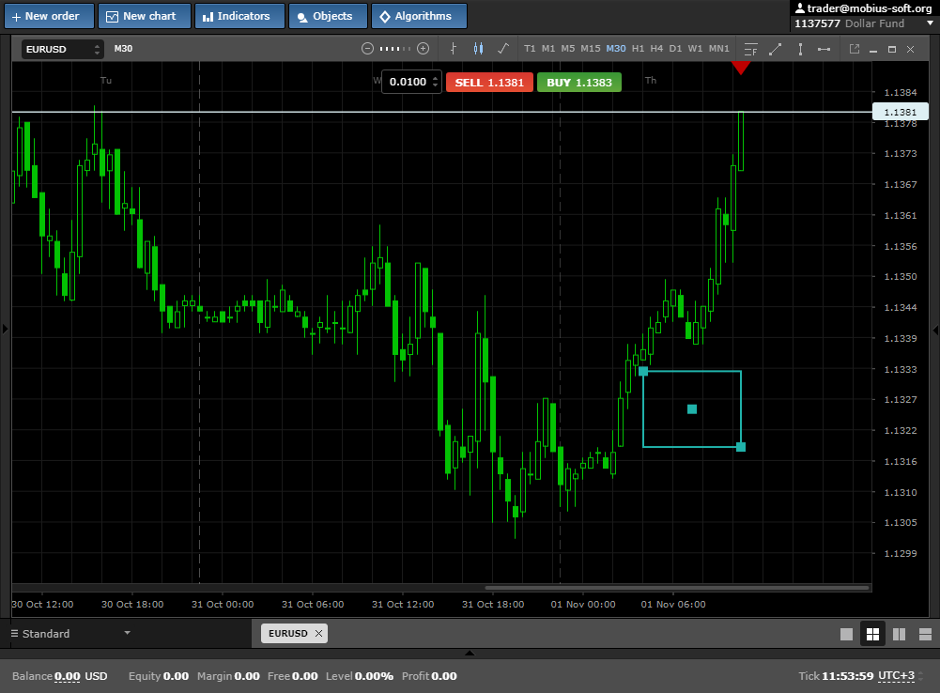
At any moment it is always possible to click one of lines of a rectangle, thereby having allocated it and to delete it or to move where it is convenient for you.
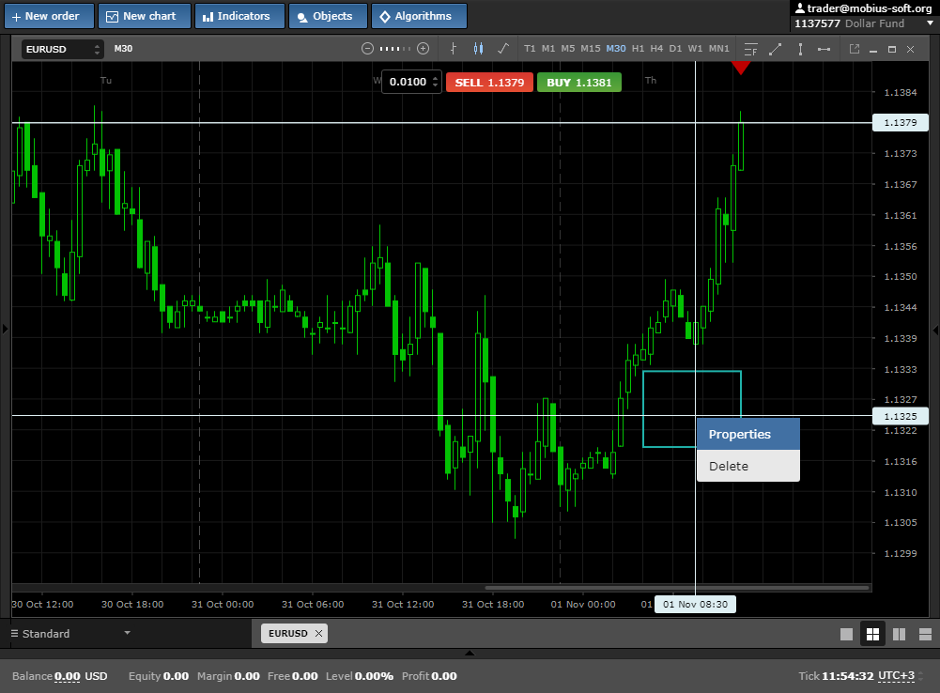
To call up window of property it is necessary to click the right button of a mouse at the line and to choose the tab Properties, as shown at the pic below.
In properties it is possible to specify color and thickness of lines,
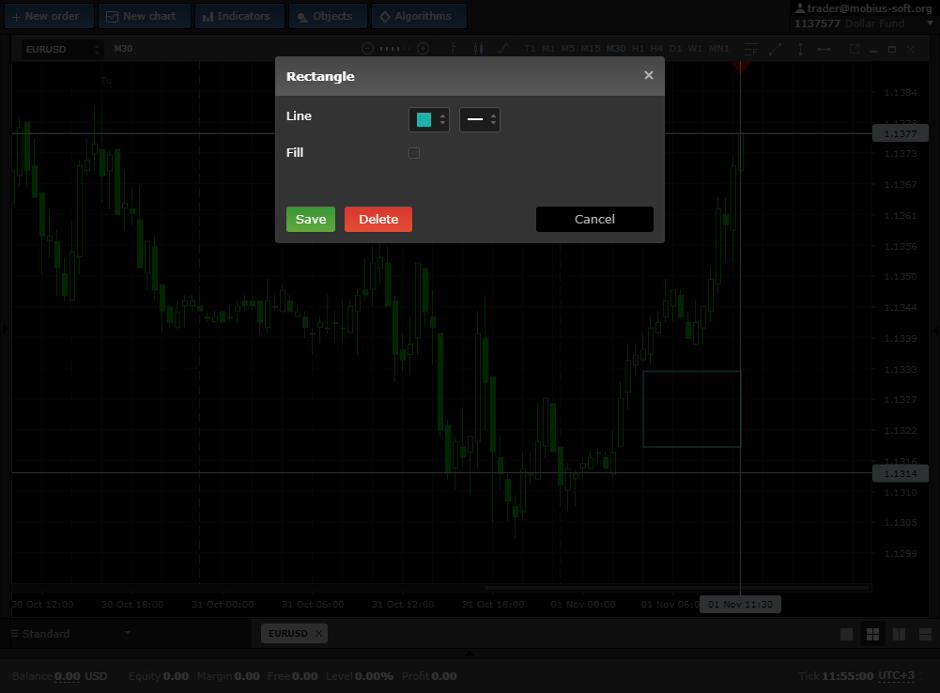
and also it is possible to fill in a rectangle, having delivered a tick opposite to the word "Filling" for better visual type on a graphics.
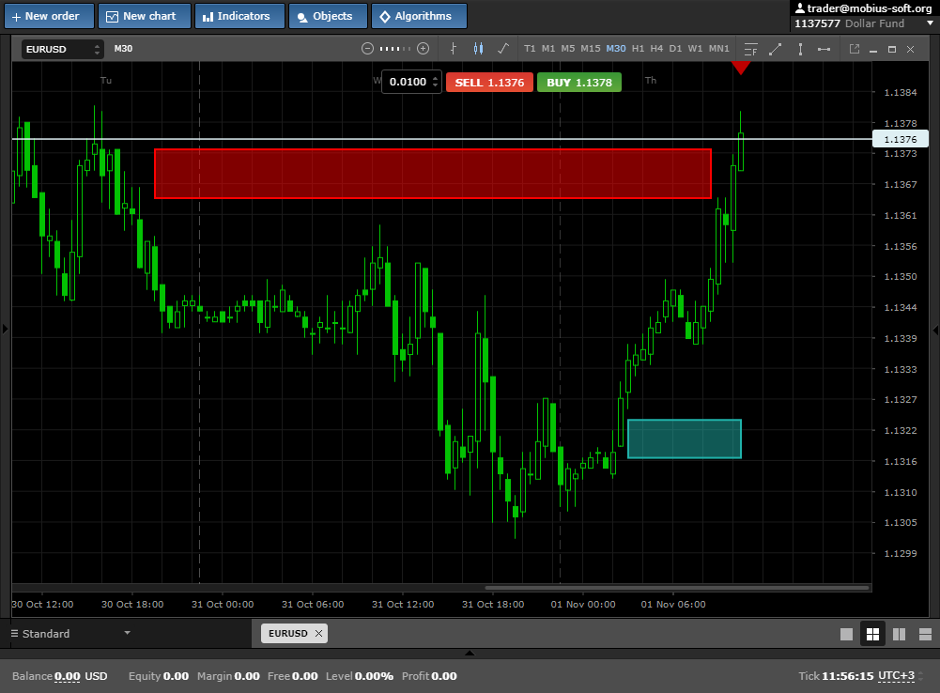
In trade the rectangle can be used for marking of the graphics and allocation of support levels on it and resistance that makes trade much more clear and more simply, as shown at the pic below.
We hope, this tool will be very useful to you in trade. We wish you high profit.
This graphical element can be discussed at forum