
 Russian
  中文
中文  العربي
  Bahasa Indonesia
 Trend line
We are glad to present you the most popular tool, for definition of a trend at graphics - the trend line.
To set the trend line at the price chart it is necessary to choose the tab Objects- "Lines" - "Trend line", as shown at the pic below.
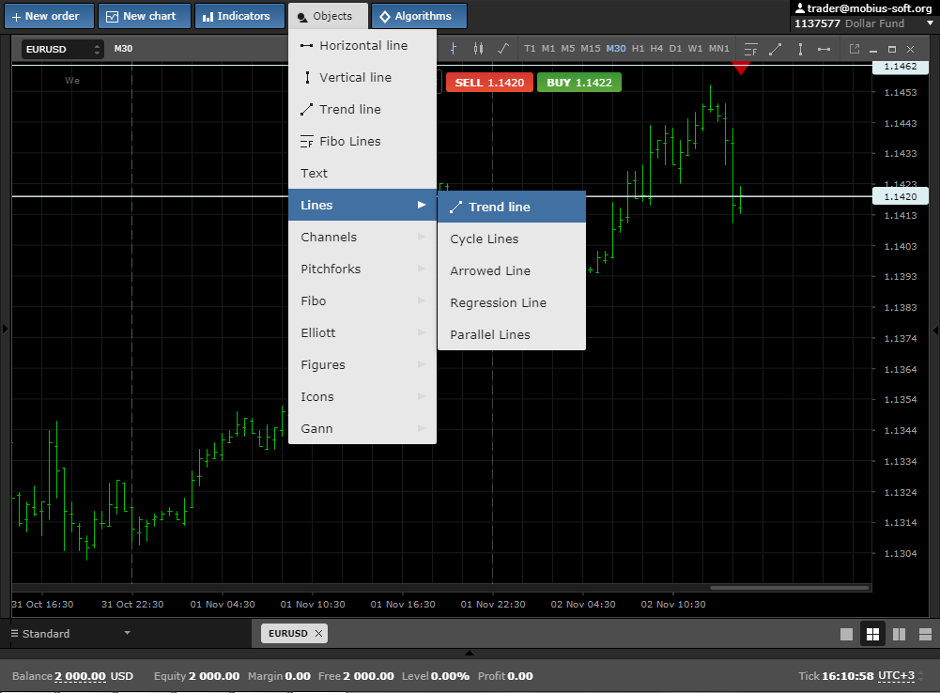
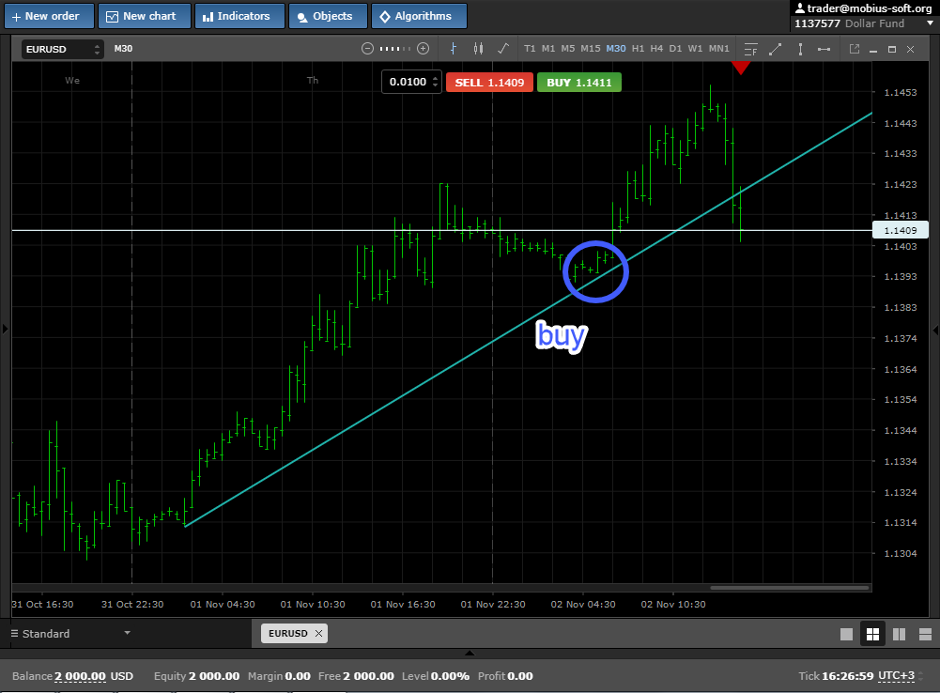
After the choice of the trend line it is necessary to choose two points on which will be drawn a line.
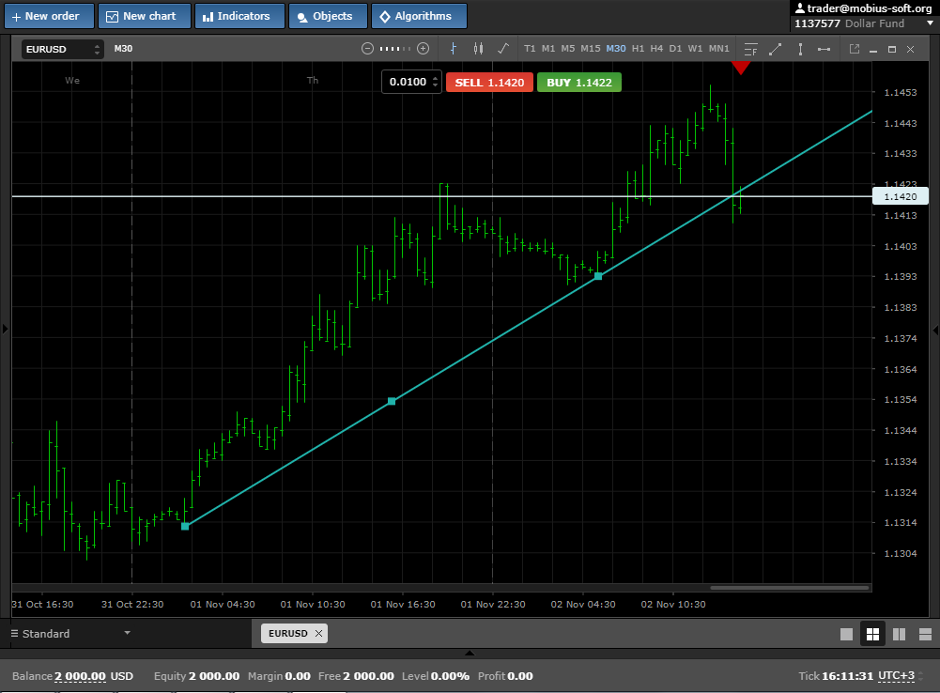
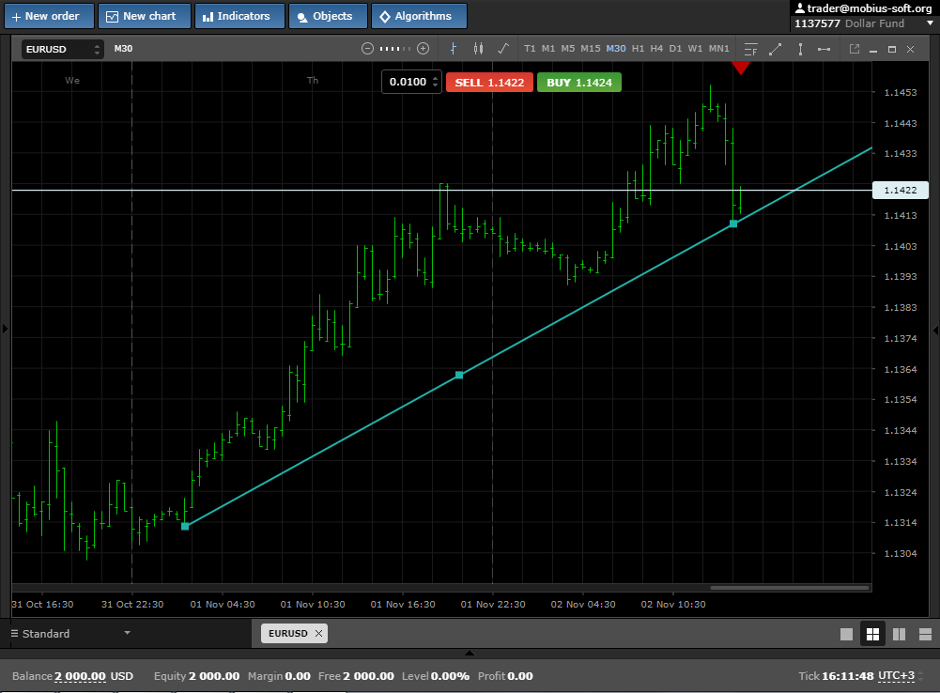
As soon as on the price chart something has changed it is possible to click once the line and to move where it will be convenient to you.
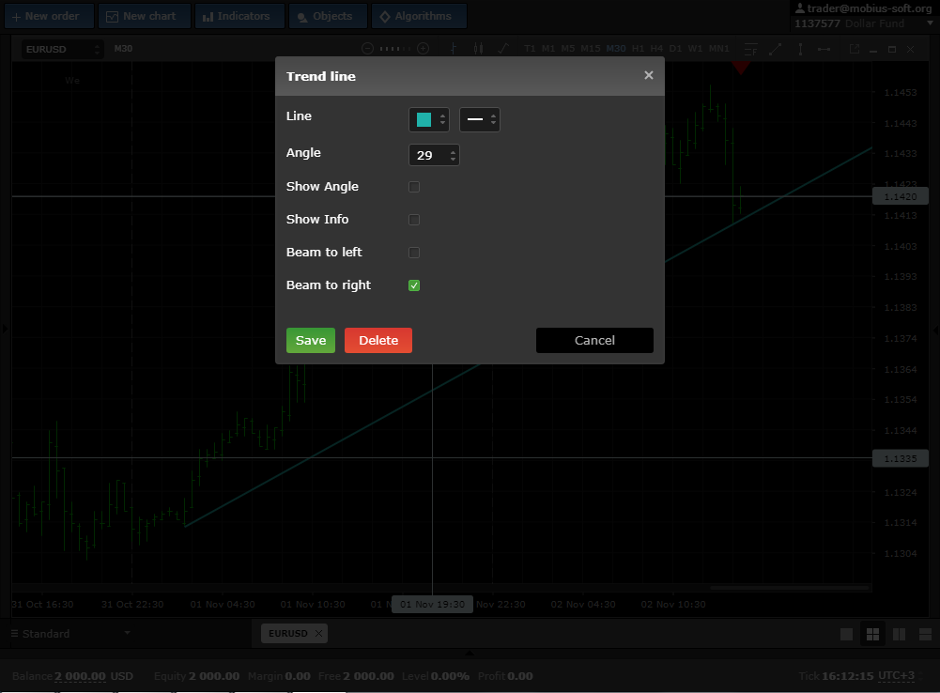
To cause a window of property it is necessary to click by the right button of a mouse the line and to choose the tab Properties, as shown at the pic below.
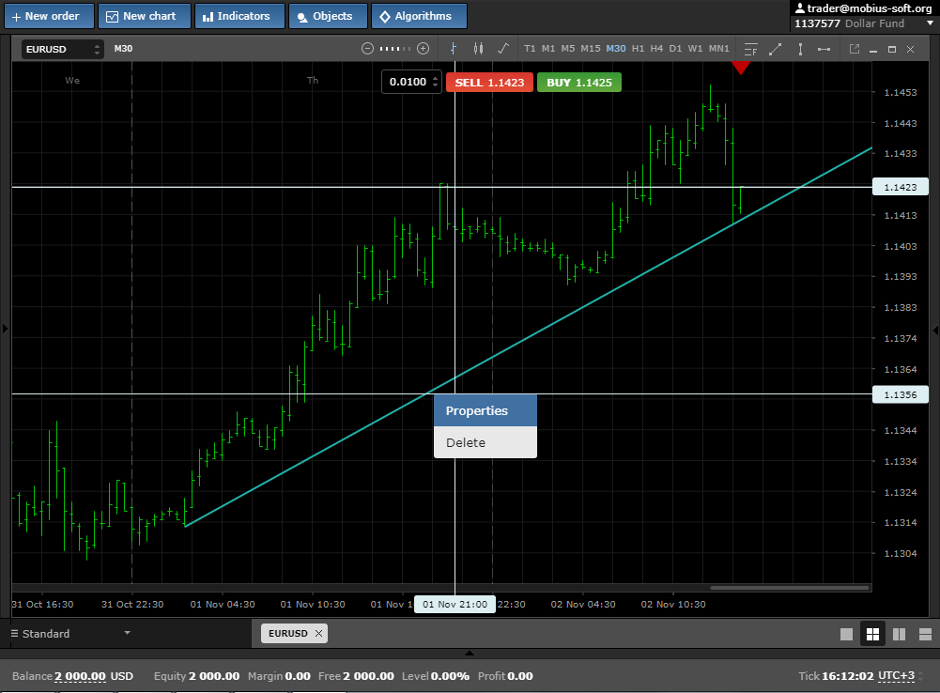
As we see, it is possible to specify color and thickness of lines, a tilt angle and also in what party to display the line indefinitely in properties having established a tick.
In trade the line of a trend can be used as the line of support and resistance.
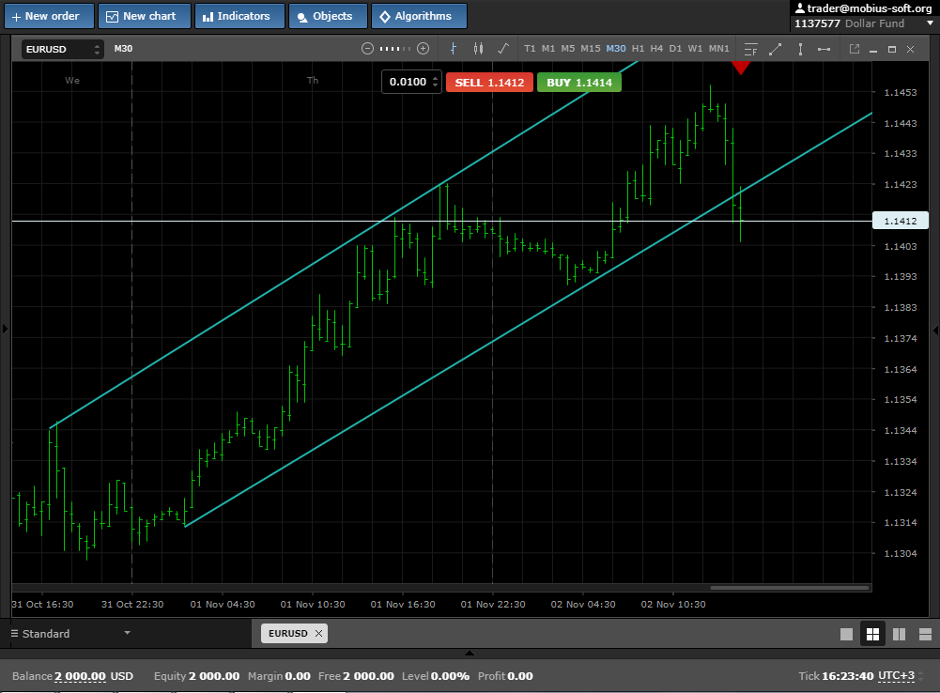
Trend lines if to place in parallel among themselves, then the channel will turn out. If we set two trend lines, then they will be called together the channel what can be seen at the pic below
We wish you high profit.
This graphical element can be discussed at forum by the link