
 Russian
  中文
中文  العربي
  Bahasa Indonesia
 Trading strategy - MACD
Let's view the system of earnings based on MACD indicator.
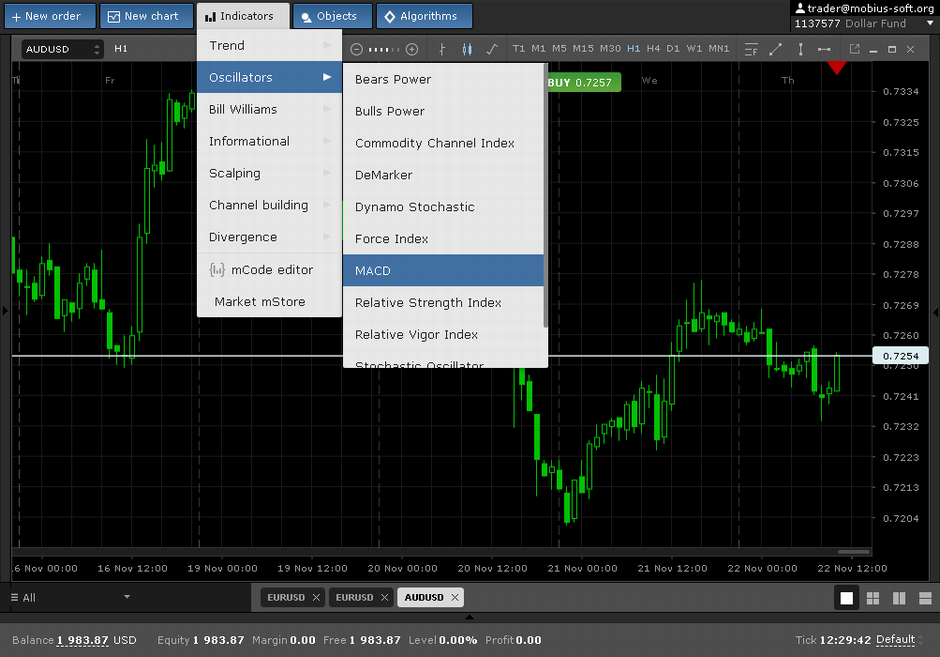
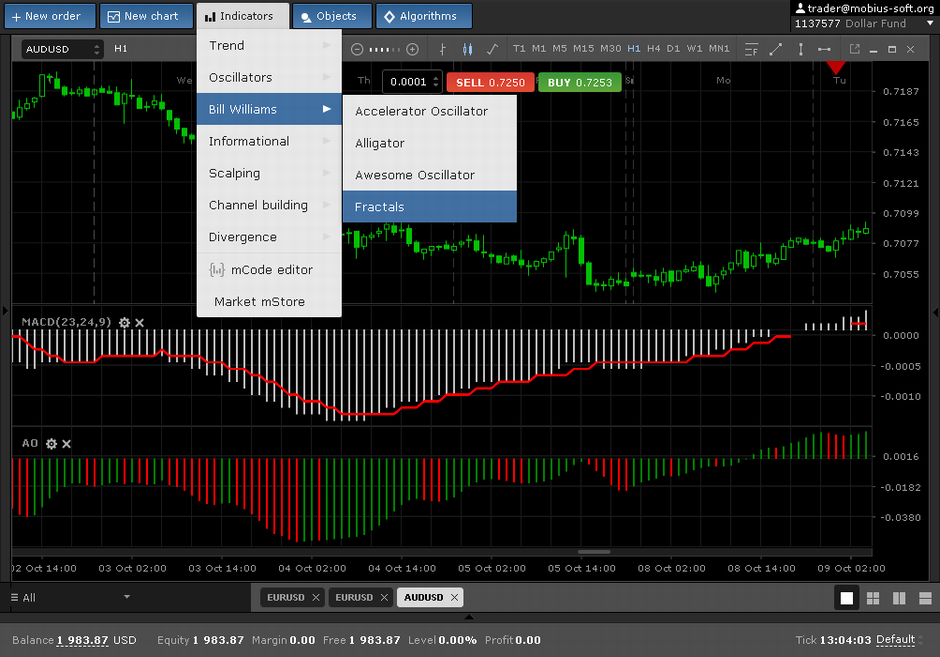
As it was told at the previous lessons, for installation of the MACD Indicator on the chart, we will click the button Indicators at a toolbar and in the appeared menu we should choose Oscillators - MACD
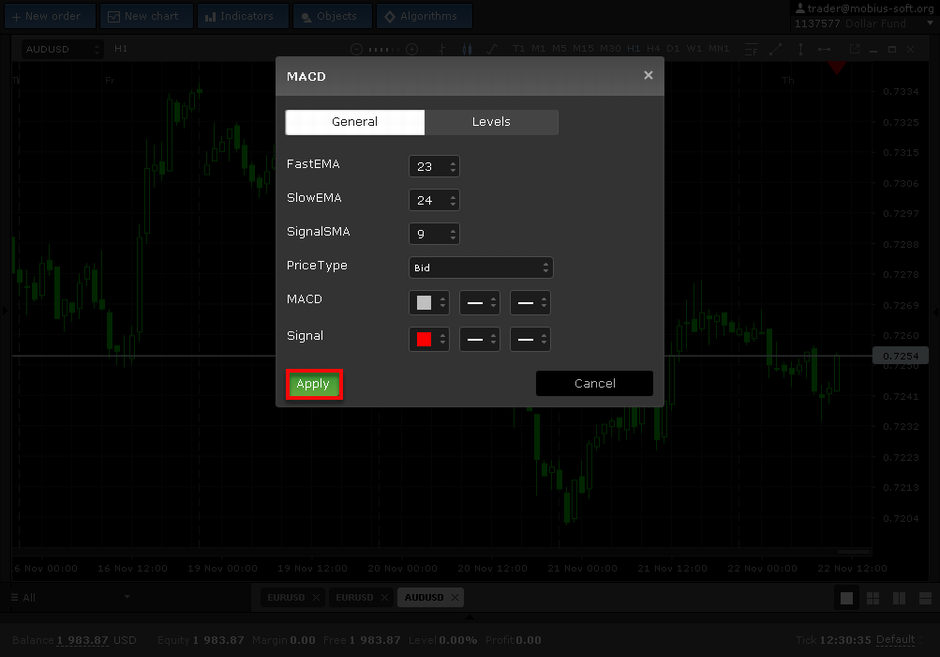
After that, will appear the window where we can change properties of the exposed indicator. For example we will install the following settings. Twenty three Twenty four and Nine, as shown at the pic below.
The histogram MACD symbolizes about the ascending trend if it is above the signal line.
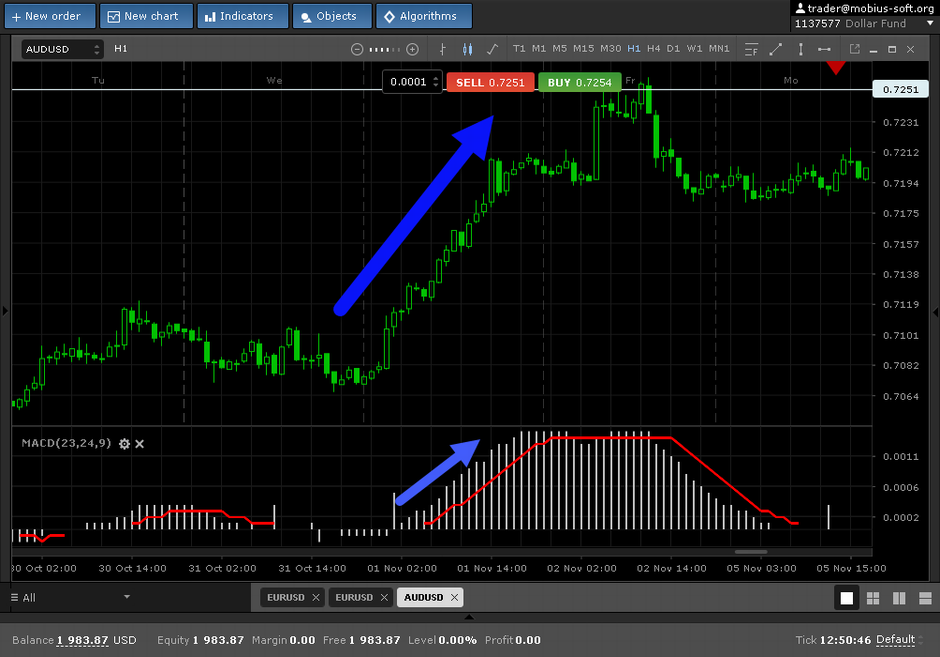
In this case we open only long positions.
Signals for Sell are ignored.
Respectively, MACD signals about the descending trend if the histogram is below the signal line.
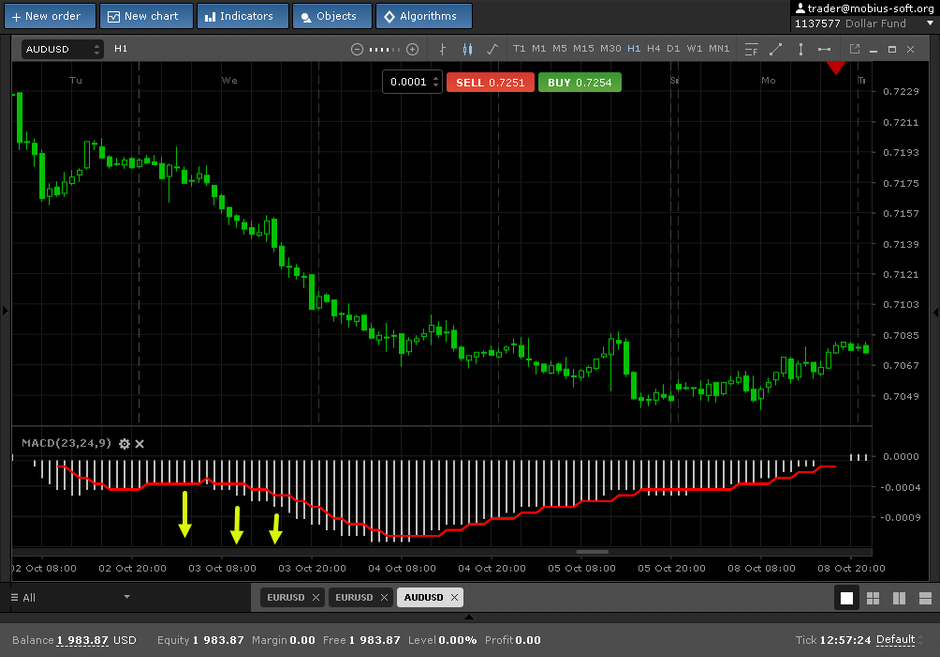
In this case we ignore signals on Buy.
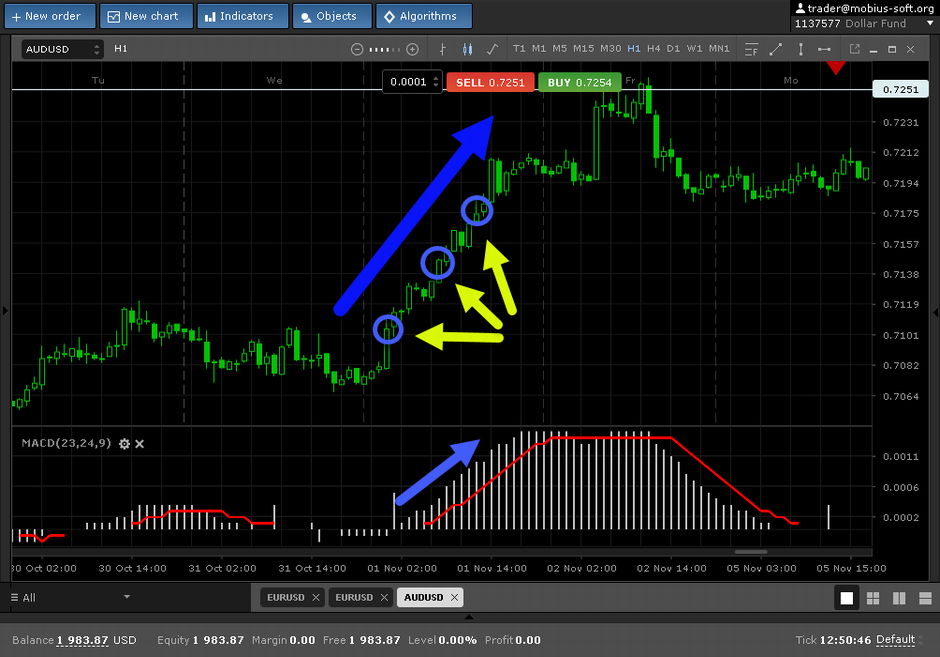
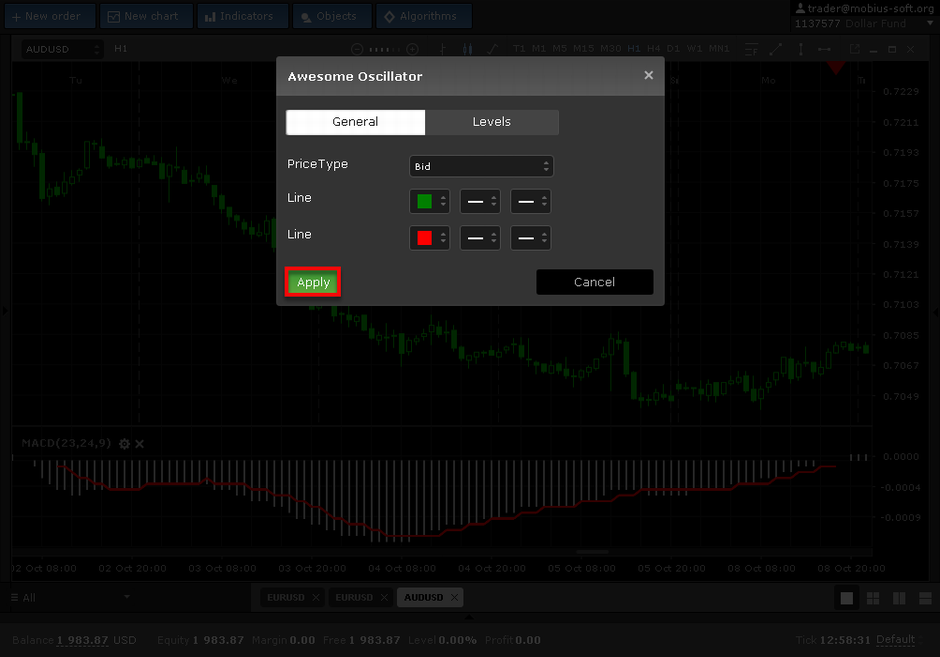
Now we need a method for determination of point of entry. For this purpose we use Awesome Oscillator of Bill Williams. As you remember, for installation of Awesome Oscillator on the chart, click the button Indicators at a toolbar and in the appeared menu we will choose Bill Williams - Awesome Oscilliator
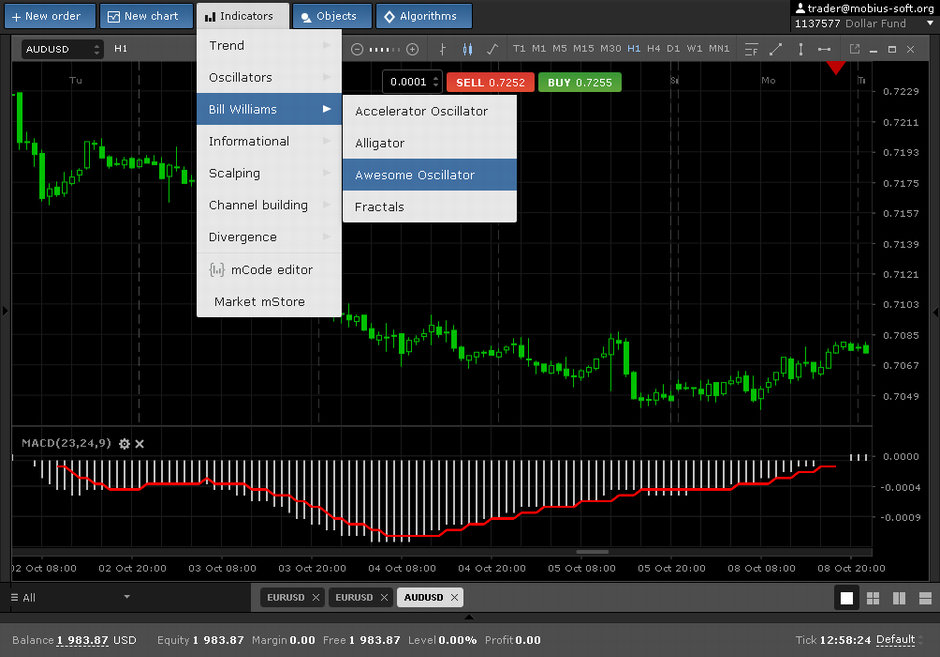
We won’t change the settings
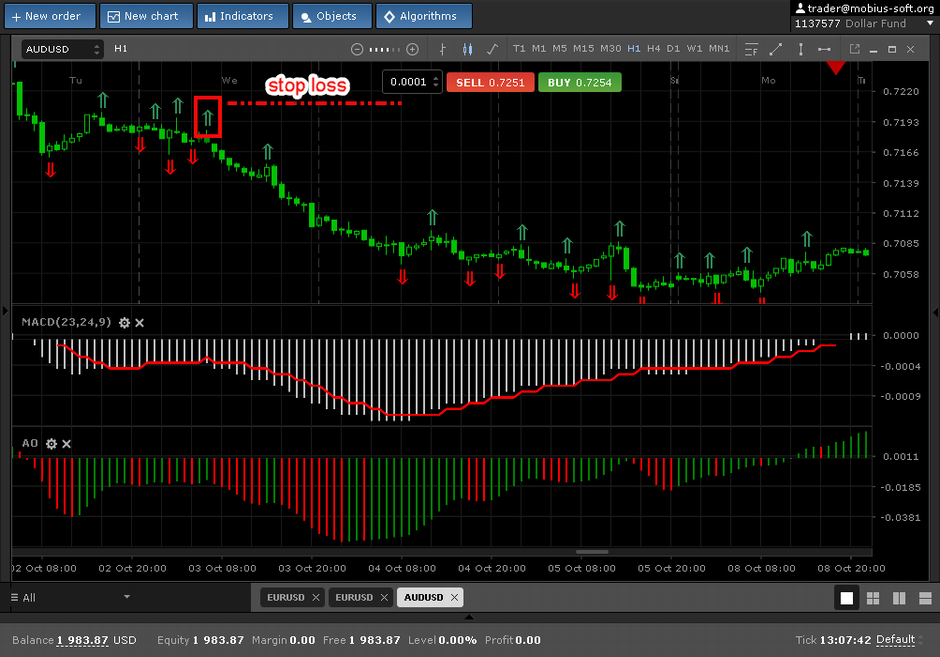
Awesome Oscillator gives a signal on Buy or Sell called "Saucer". Red bar after two green, or green bar after two red. It is a signal of a turn.
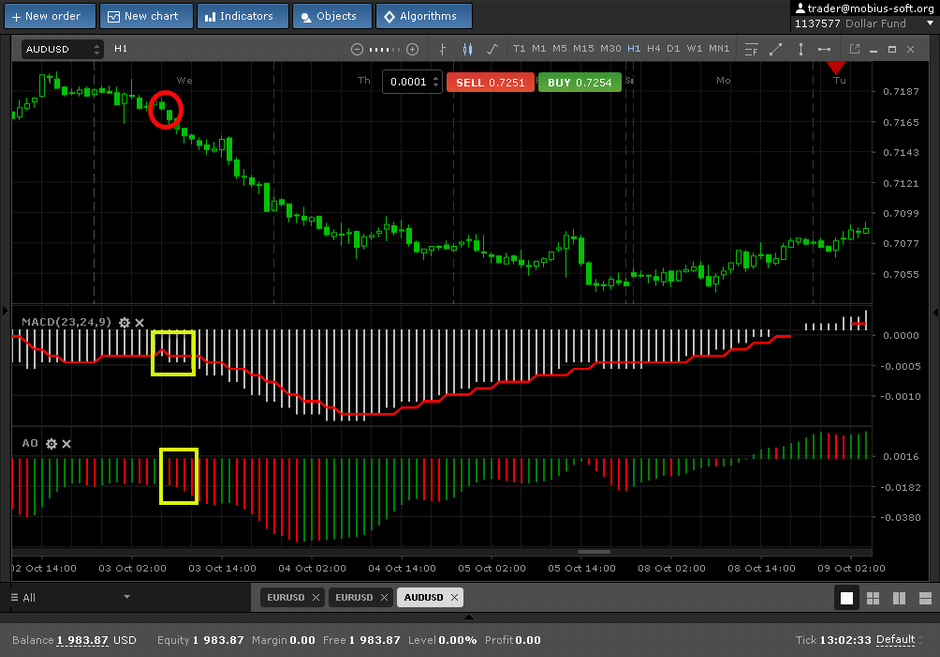
For complete strategy we should bring tactics of an exit from the transaction.
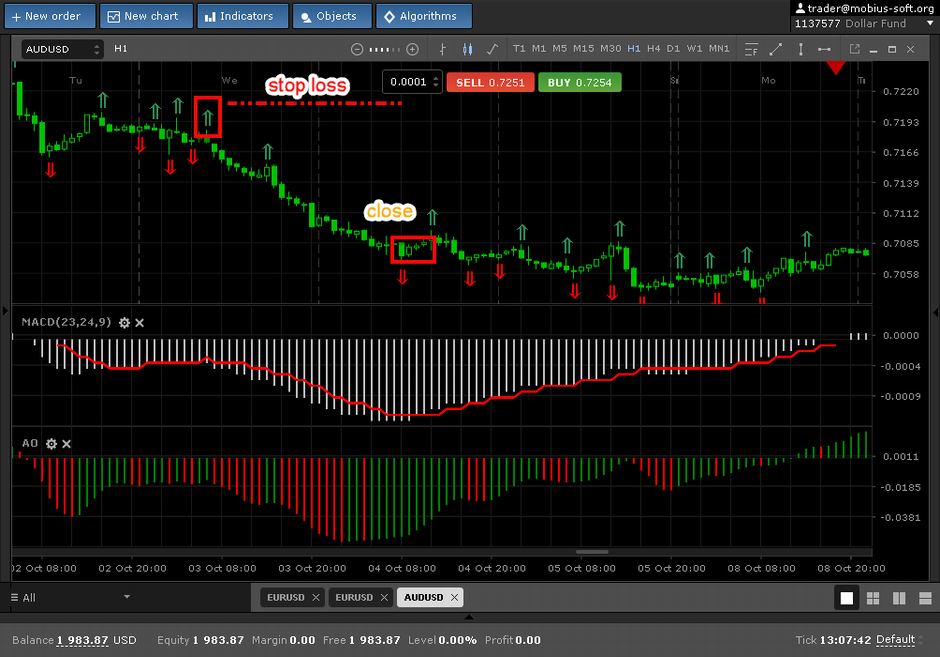
Stop loss, limiting losses, we set on the level of the last fractal which can be installed from the section "Bill Williams" - Fractals.
Also, we leave the transaction if we receive a signal, opposite in the direction for an entrance.
We wish you success and big profit.
It is possible to discuss this strategy at forum