
 Russian
  中文
中文  العربي
  Bahasa Indonesia
 Patterns
Graphic patterns are repeating figures that the price writes on the chart. As a result of observations of traders, as well as automatic analysis using modern computing power, clearly traced patterns were found. Thus, characteristic figures were found that testify to the origin, continuation or end of the trend.
Theoretical background
Proponents of technical analysis argue that the information on the chart is enough to build effective forecasts for the future. The fact is that the graph clearly shows the repetitive situations from time to time, to which the market reacts in approximately the same way. For example, a slowdown in intensive price increases signals that the “bulls” have already begun to run out of steam and the “bears” are preparing to enter the market, making money on a depreciation. The market takes everything into account and this is displayed on the chart in the form of characteristic visual designs.
A brief overview of patterns
There are a large number of varieties of patterns; they are all divided into two categories trend reversal patterns and trend continuation. All patterns have characteristic features. Typically, the price is within a certain figure (flag, pennant, wedge, triangle), and a trading signal arrives at the moment of breaking through the borders from below or above. So, consider the most popular technical analysis patterns.
“Flag” is the period of price correction after a sharp jerk (flagpole), fall or rise in prices. Usually signals the continuation of the main trend.
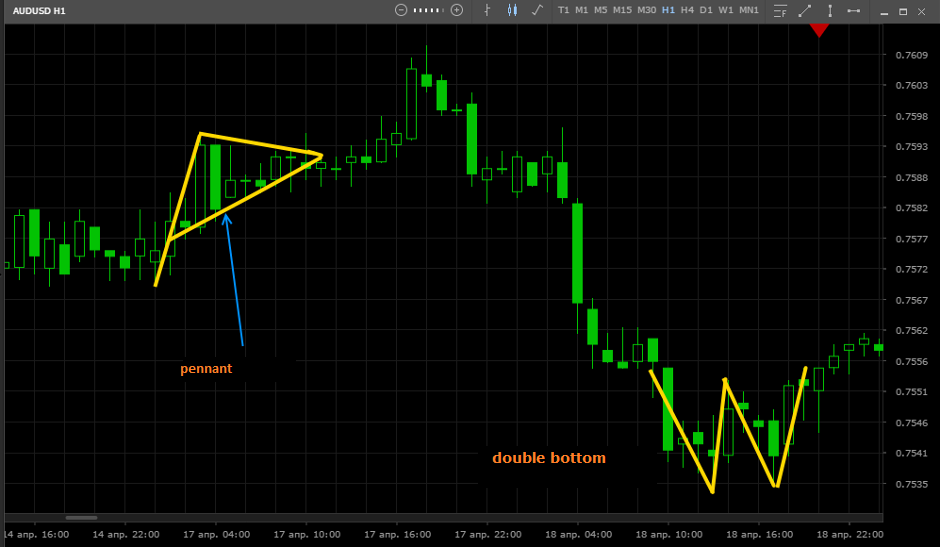
Pennant is a type of flag that differs in the shape of a triangle.
“Double / Triple Top” is the price is in a flat (horizontal movement) and approaches two / three times to the same level of support and resistance.
“Head and shoulders” is a variant of the “triple top”, when the average maximum price (head) is approximately one and a half to two times more than the surrounding peaks (shoulders).
“Triangle” is the range of price fluctuations decreases with each local maximum and minimum. The completed pattern usually precedes the continuation of the main trend.
All considered patterns appear on both uptrend and downtrends. In the second case, they are mirrored: double / triple bottom, inverted "head and shoulders", etc.
Pattern Recognition
To recognize the figure depicted in the graph, visual analysis methods are used. For example, the image below shows a typical example of a “flag” (purple lines), a breakdown of the lower border of which serves as a signal to the beginning of a downtrend.
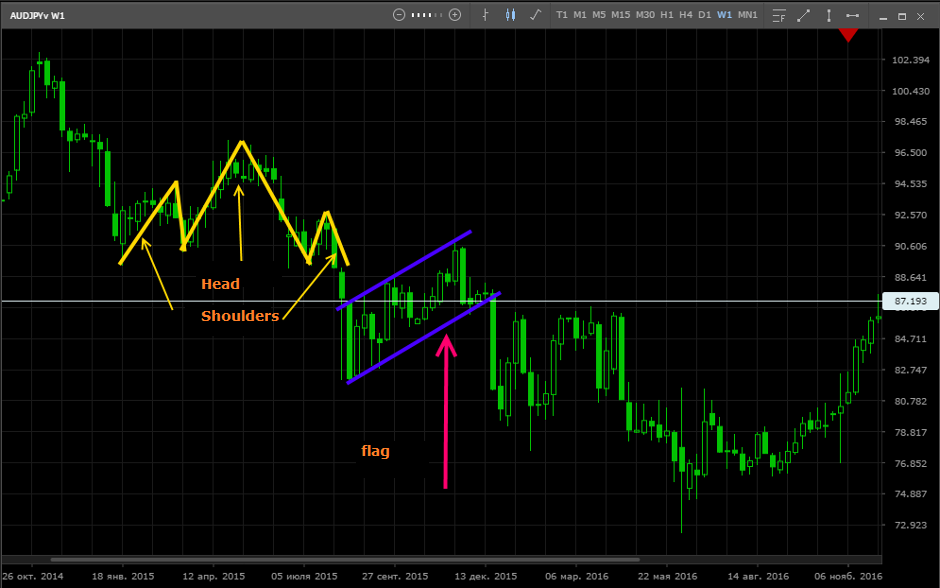
In most cases, in one fragment of a graph, several characteristic figures can be recognized simultaneously. So, in the picture of the terminal below, the figure “Head and shoulders” is clearly visible, for clarity, it is marked with yellow lines, and a flag.
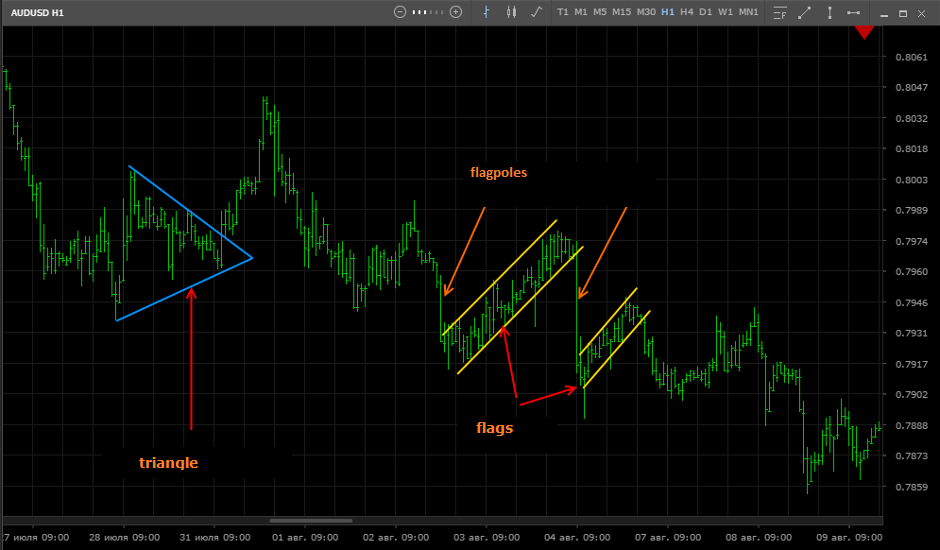
Above are examples of flags and a triangle, and in the picture below is a characteristic pennant. It also presents a “double bottom”, it is the same “double top” that only occurs when a downtrend reversals.
For the convenience of conducting technical analysis, drawing tools are used lines, rays and other shapes. With their help, you can clearly capture recognized patterns on the chart.