
 Russian
  中文
中文  العربي
  Bahasa Indonesia
 Trading Technologies: What are Pivot Points
One of the tasks of technical analysis is to determine the levels at which the current trend may change. Many traders use the so-called pivot points in their work, marking on the chart areas that may be successful entry points or goals for taking profit. Today we’ll talk about what pivot points are and how to use this tool when planning transactions.
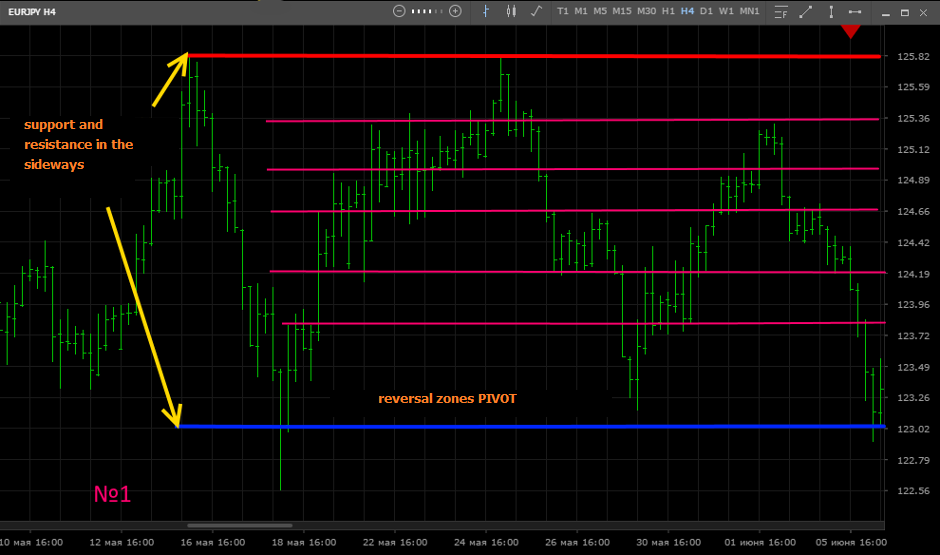
Pivot points (levels) give the trader an idea of where to expect a reversal in the near future. This significantly expands the possibilities instead of waiting until the price approaches the borders of the channel and only then make trading decisions, you can trade on the signs that are formed in the Pivot zone. In the figure below you can see the levels of support and resistance of the side trend (white) and reversal zones (colored):
How to identify pivot points?
However, how are these pivot points calculated? Unlike support and resistance levels (for price movement in the channel), pivot points cannot be determined visually, for this mathematical calculations are used. Pivot points are calculated separately for each time period, respectively, for the M30 timeframe, pivot points will be at different levels than for the H4 timeframe. This is another difference between the Pivot points and the support and resistance levels (sideways), which remain unchanged on different timeframes.
Pivot Pivot Point Calculation
The pivot is the arithmetic average of three indicators this is the price level at the maximum, minimum and at the close of the previous period (for example, the past trading session). Accordingly, the Pivot base point (PP) is calculated using the following formula: PP = (Close + High + Low) / 3.
Example. It is necessary to calculate the PP for June 30, 2017, for this we need the indicators of the session, which ended. To get data on the previous session, you need to open the daily chart (D1), find the candle that displays all the price movements for June 29:
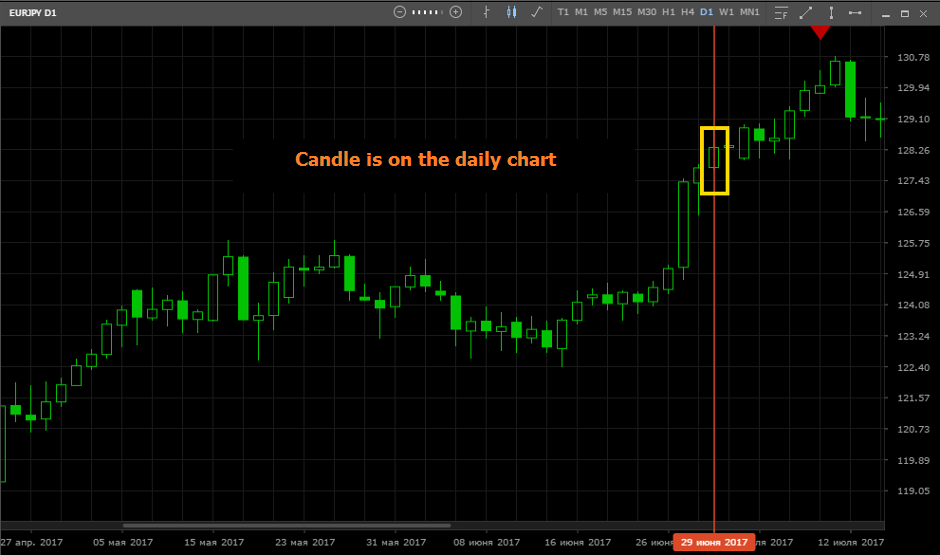
On June 29, the EUR / JPY closed at 128.31 (Close), during this session the high (High) was at 128.83, and the low (Low) was at 127.72. Now we consider:
(128.31 + 128.83 + 127.72) /3=128.28;
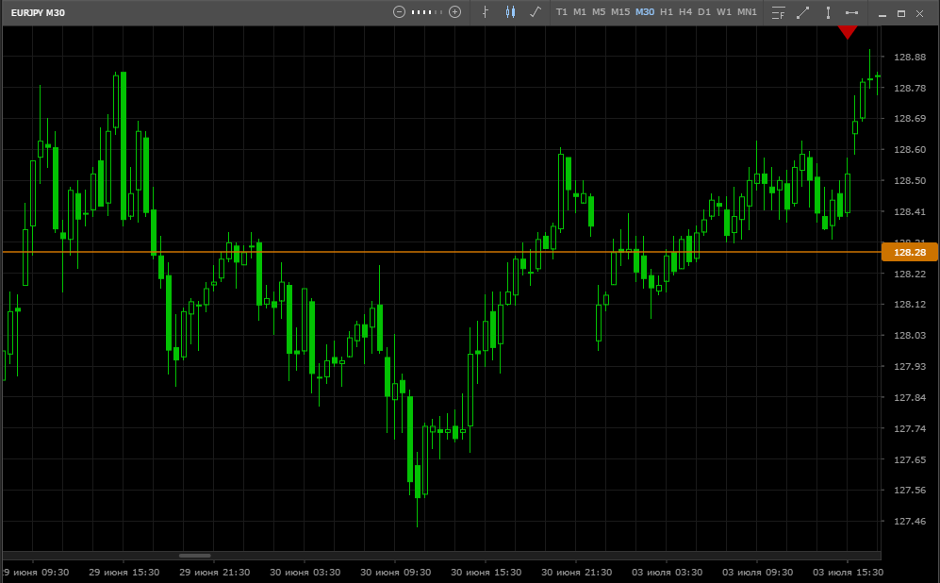
This is the base level, put it on the chart, for convenience, go to the M30 timeframe:
Calculation of support and resistance zones Pivot
After this, the derivatives are calculated these are the support and resistance levels relative to the Pivot base point. As a rule, traders use three support levels and three resistance levels, however Pivot points can be greater, for example, five support levels and five resistance levels. The following formulas are used for calculation:
Resistance Zones (R - Resistance):
The first resistance is R1 = 2PP – Low;
The second resistance is R2 = PP + (High-Low);
The third resistance is R3 = R2 + (High-Low).
Support Zones (S - Support):
First support S1 = 2PP-High;
Second support S2 = PP- (High-Low);
Third support S3 = S2- (High-Low).
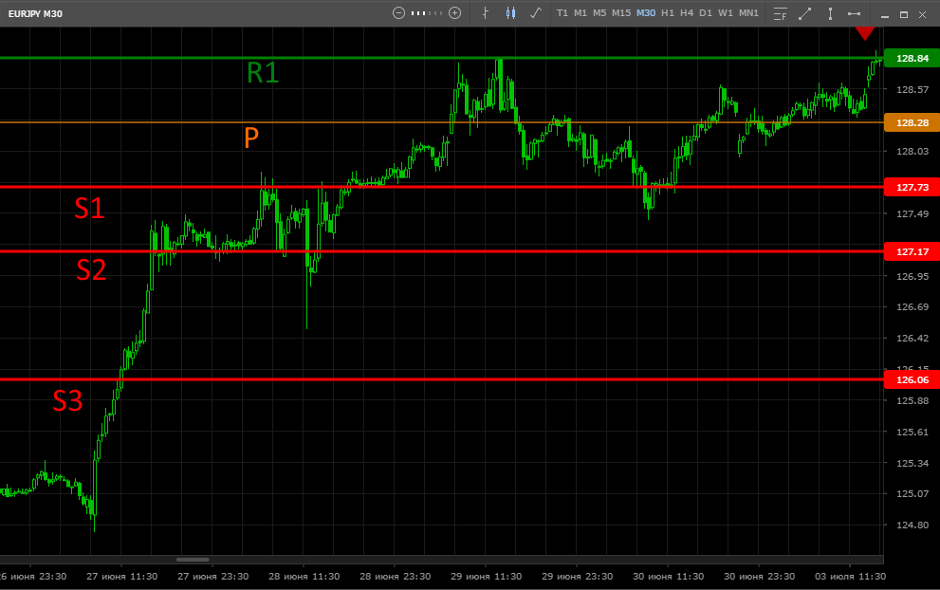
We consider the support and resistance levels in our example, the PP point for June 30, 2017 is at 128.28, the indicators of the previous session are also known (High 128.83 and Low127.72). We calculate the levels using the above formulas:
Resistance Zones (R - Resistance):
First resistance R1 = 2 * 128.28 - 127.72 = 128.84
Second resistance R2 = 128.28 + (128.83-127.72) = 129.39
Third resistance R3 = 129.39+ (128.83-127.72) = 130.5
Support Zones (S - Support):
First support S1 = 2 * 128.28-128.83 = 127.73
Second support S2 = 128.28 - (128.83-127.72) = 127.17
Third support S3 = 127.17+ (128.83-127.72) = 126.06
We draw the support and resistance lines on the chart:
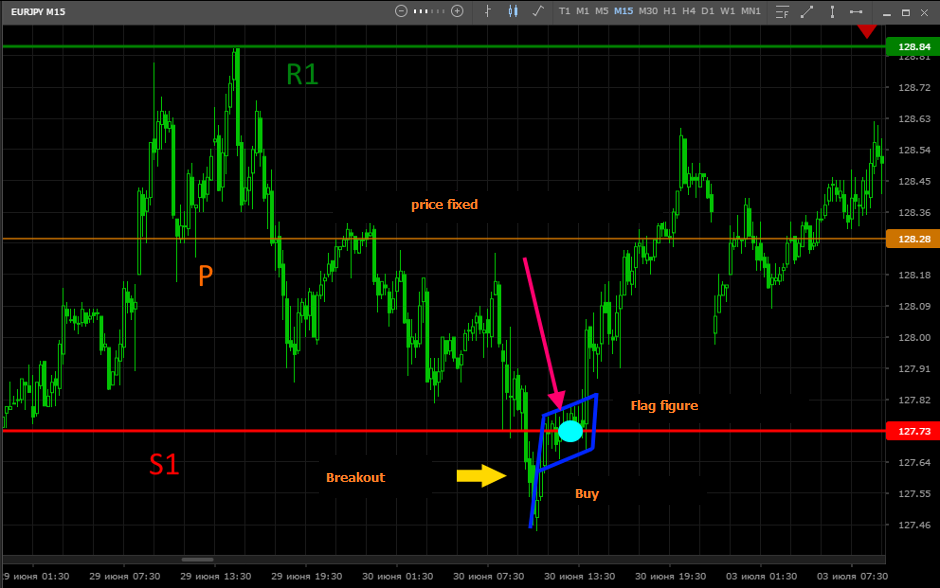
Now you can work on the levels found, for convenience, go to a smaller time-frame (M15) to clearly determine the trading period. We use the support level to search for a pattern in the zone of the first support, and we find it the price has sharply broken through the level, but then a no less sharp rebound followed, after which the decline stopped and the price fixed at the support level. It is highly likely that the breakdown was false, in addition, a “flag” figure (sideways after a sharp rise) was formed on the chart, which is a sign of continued movement. The figure shows a favorable entry point:
There are various methods for calculating Pivot points, in addition to the classic version of the calculation formulas, there are also Pivot points according to the method of Woodie (Woody), Camarilla (Camarilla), according to the method of Demark. The differences lie in several different mathematical approaches used by the authors of these methods.
Currently, it’s not necessary to spend time calculating Pivot points using a calculator. There are a number of sites on which pivot points are calculated automatically, moreover, for each standard timeframe and for each asset traded. Simply transfer the levels to the chart of the trading platform using the built-in drawing tools.
What is a session close price
Most often, traders use pivot points when planning a trading session. Accordingly, the past session has already closed, and the last value necessary for the calculations (closing price) is known. But this is all simple, for example, if you trade in exchange-traded assets, because after the closure of the exchange, trading is not conducted, and quotes are fixed at a certain value. But what about traders working with currency pairs, because assets are traded around the clock, and the interbank market is functioning non-stop? What is the closing price in this case?
Traders resolve this issue as follows: the price that is observed on the chart at the end of the Asian, American, European and Pacific sessions is taken as the closing price of the period. Accordingly, it is possible to get pivot points for each new session.
How to use pivot points
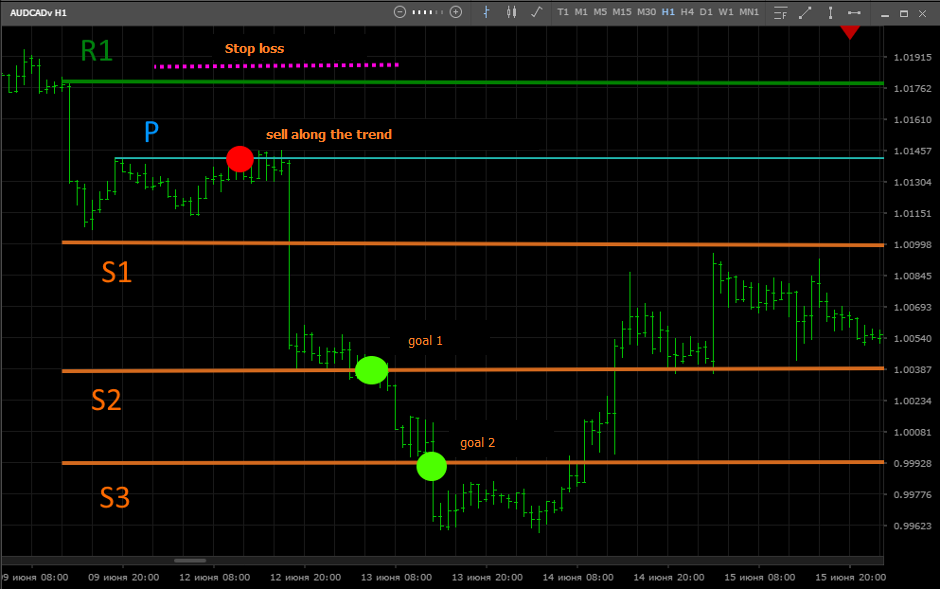
So, first the pivot point is calculated, and then the resistance and support points, all points are plotted on the chart in the trading terminal. Marked points can serve as guidelines for setting stop loss and profit targets. For example, you can open a sell deal at the price of a pivot point (in the direction of the current trend). In this case, the stop-loss should be placed slightly higher than one of the resistance points, and when the price approaches the next support point, you need to look for signs of a reversal or continuation of the trend (according to the trading system).
Do not forget that Pivot points are calculated separately for each timeframe, so always use the pivot points of the time period with which you are working. If the strategy involves the use of several timeframes for analysis at once, then you need to calculate the pivot points for each of them. In addition, we give a few signs that guide traders using pivot points:
If, at the opening of a new session, the current quotes of the asset are below the pivot point, there is a high probability of a downtrend and vice versa;
A breakdown of the first resistance level and price fixing above this level indicates the probability of an uptrend, and overcoming the first resistance level may be a sign of a downward movement;
If at the opening the price fluctuates between the first resistance level and the first support level, this may mean that the market expects news to be released, which will set the trend;
A sign of a good trend can be a sharp breakdown of the first or second level.
Conclusion
Pivot points are a very powerful tool. However, it must be remembered that Pivot points are effective only in combination with those signs of a reversal and continuation of the trend that your trading system suggests. In addition, you need to understand that with different financial instruments, turning points can work out better or worse, so you should spend some time testing.
In addition, it should be noted that when practicing the levels indicated on the chart, it is necessary to take into account the publication of economic news. Before the news release, it is advisable to adjust the hundred-loss and take-profit, so that a sharp surge in prices (for example, a false break) does not lead to losses.