
 Russian
  中文
中文  العربي
  Bahasa Indonesia
 Trading systems on indicators
The article on indicatorless systems of technical analysis concluded that they are sufficient for making trading decisions. In this regard, a logical question arises about the need and feasibility of using various indicators. We will talk about this below.
The first acquaintance with the indicator occurs when you select a linear display of prices in the trading terminal.
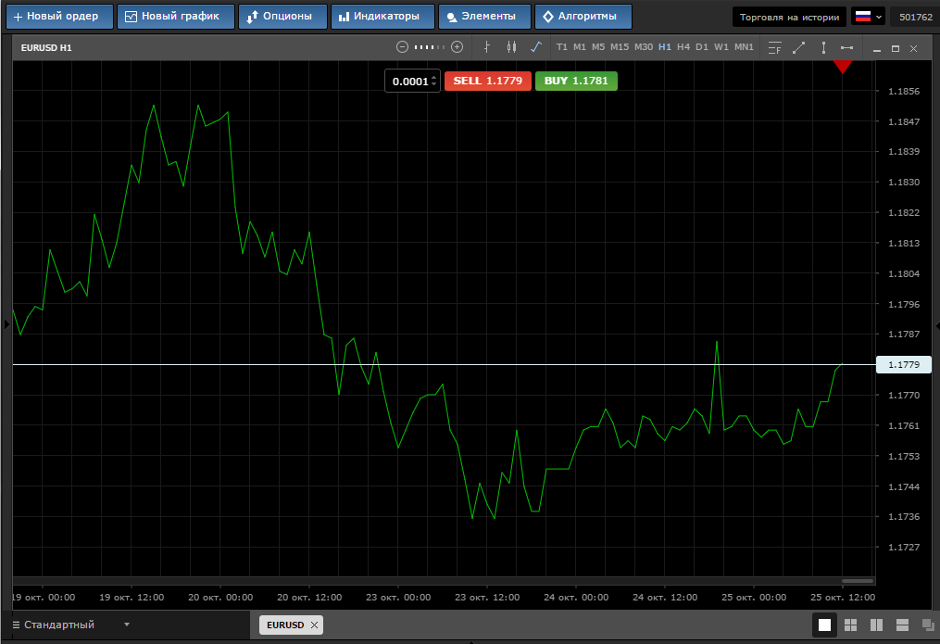
What we see on the screen is nothing more than a simple moving average with a period of 1.
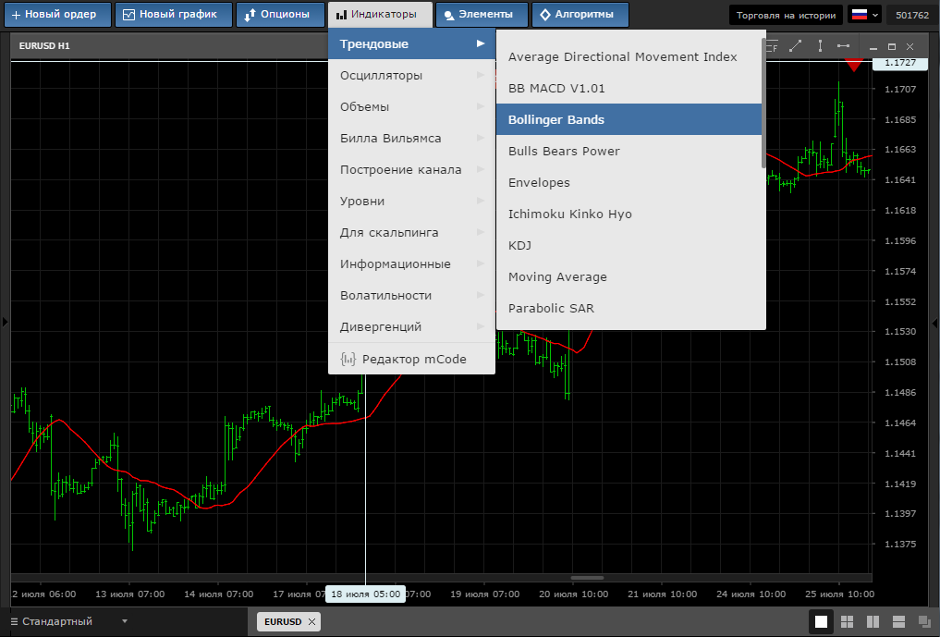
So what are the indicators? For viewing, we will use the “Indicators” tab on the terminal control panel.
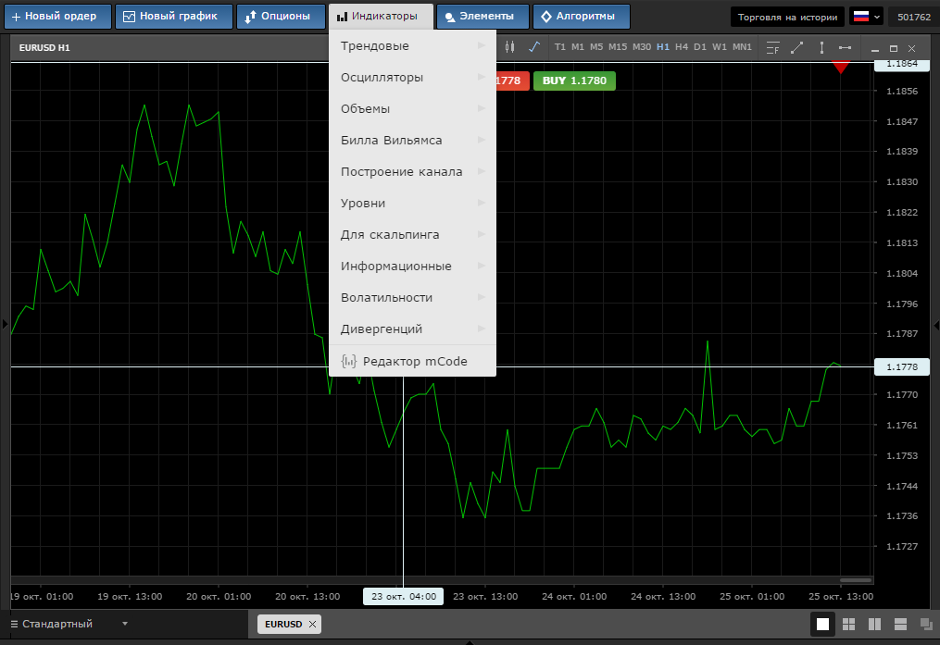
The first in the list are trend indicators. As the name of the group implies, their functional purpose is to monitor the existing trend and trade in its direction. The use of trend indicators is not recommended when trading in the range. This can lead to an incorrect interpretation of the current price movement and, as a result, to an erroneous decision when opening a position.
Oscillators take the second place on the list. Their main purpose is to signal the trader about the possible end of the current trend and proximity to the pivot point. It is possible to use oscillators in both trend and flat movements.
When building technical analysis systems, it is optimal to use both groups of the above indicators to more fully display the current situation of the instrument. From a logical point of view, the oscillator helps to identify the end of a trend when doubts appear in the readings of a trend indicator.
Everything in the list below the two briefly described groups refers to auxiliary indicators.
Volume indicators help in making decisions on opening a position at a specific point, based on abnormal trading volume at the current moment in time.
Channel construction and levels help to conditionally outline the price movement corridor either inclined in the case of a trend or horizontal in the case of sideways movement.
As a simple example, we will build an analysis system using the most common and effective indicators that have been used for decades and at the same time have not lost their relevance and effectiveness. To do this, back to the first image in this article.
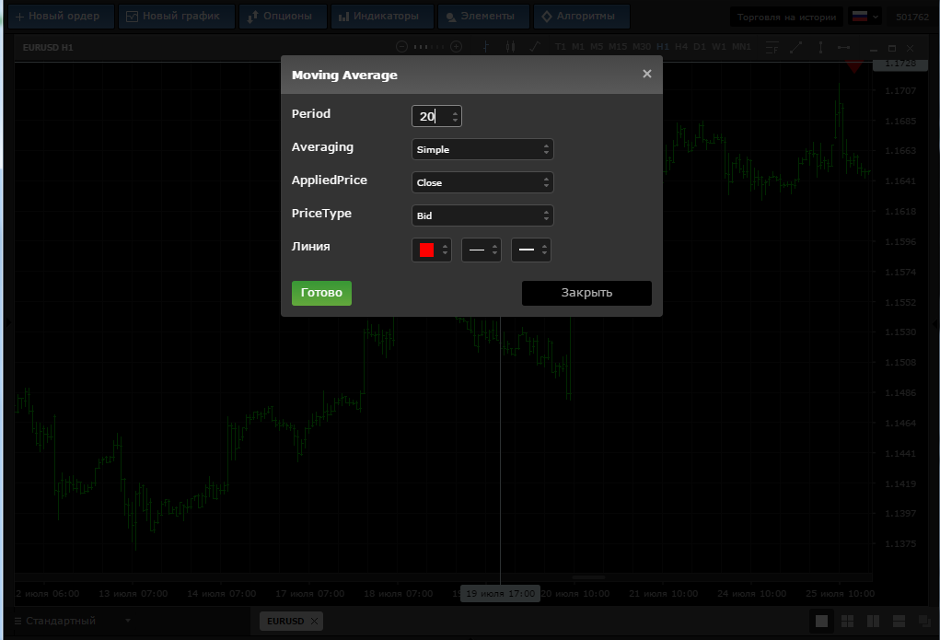
As the first element, we use the MA indicator
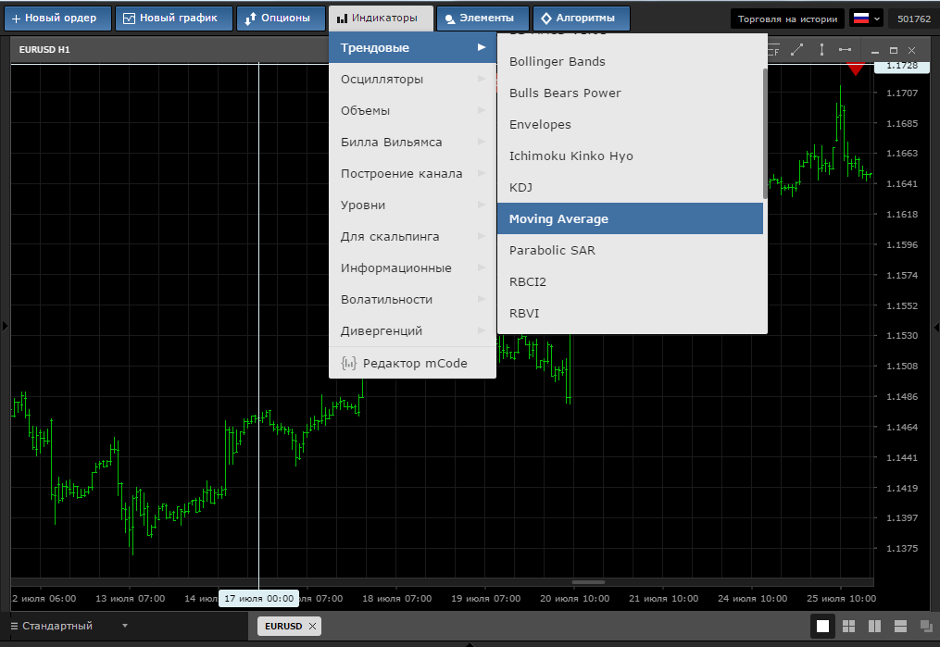
Let's choose its settings
In the terminal window, we see two moving averages, a thin green line (chart bars) - period 1 and a bold red - period 20. This is the simplest technical analysis system that generates signals to open trading positions when the price crosses the indicator line in the direction of intersection, or the end of indicator lines in the direction of the current trend.
Now let's complicate the system a bit on the basis of MA with a period of 20, we add the BB indicator with the same period.
To do this, on the indicators tab, select BB and set on the chart.
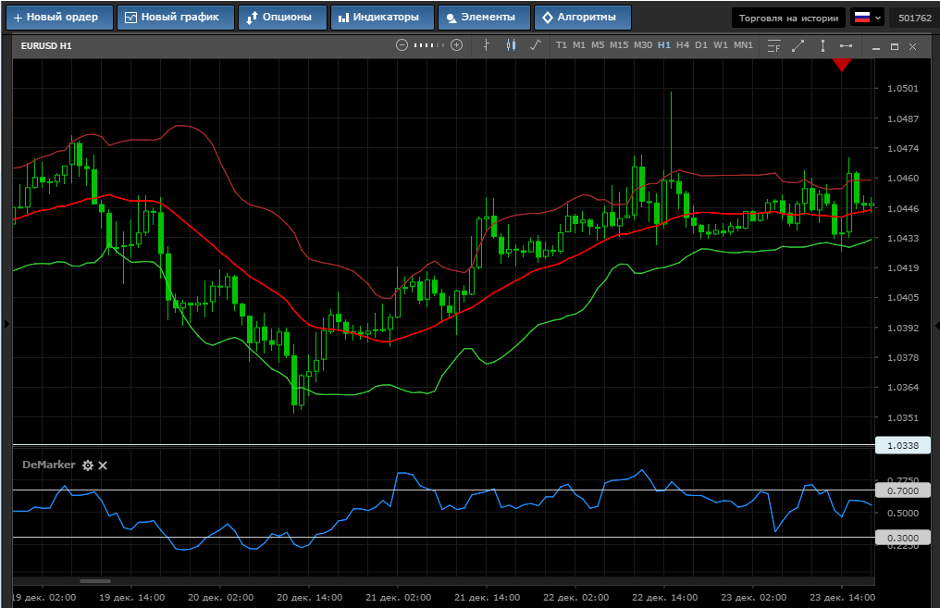
Two more lines were added to the chart, one of them in red is above the price and the second below the price is green. In terms of analysis of movement, this indicator adds information on volatility and sets the dynamic boundaries of a possible change in the price range.
And the last indicator for the analysis system is using the DeMarker oscillator with standard settings. The difference from MA and BB is that the indicator is built in a separate window below the price chart. It carries information about the overbought / oversold state of the instrument and also shows divergences and serves as a filter in deciding whether to open a position.
Also, in conclusion, we perform one more simple manipulation we connect the Japanese candles and with them all the advantages described in the article on indicatorless analysis.
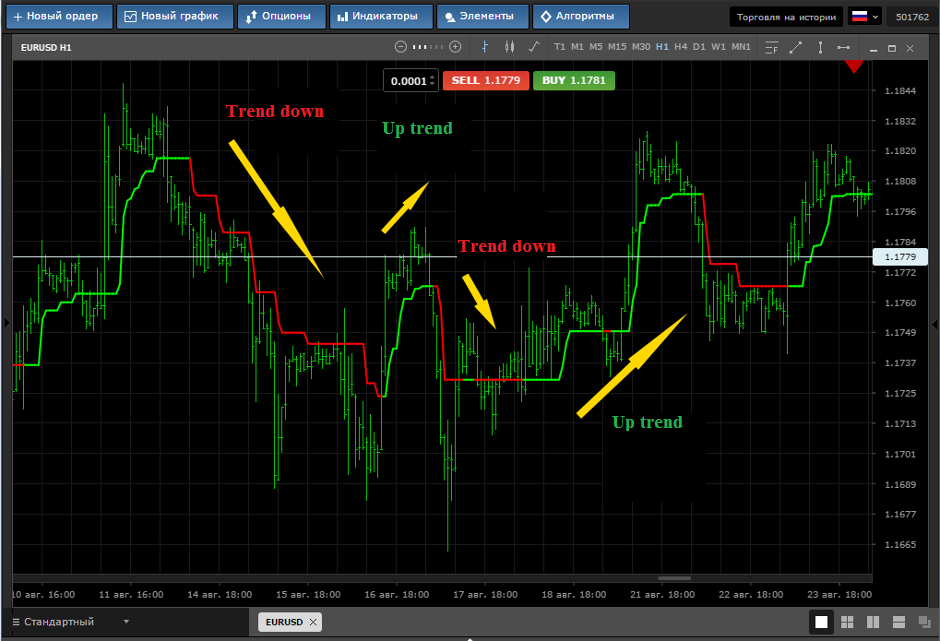
Now, with good reason, we can consider the system sufficient. Consider examples of generating signals to enter the market. To do this, use the last picture.
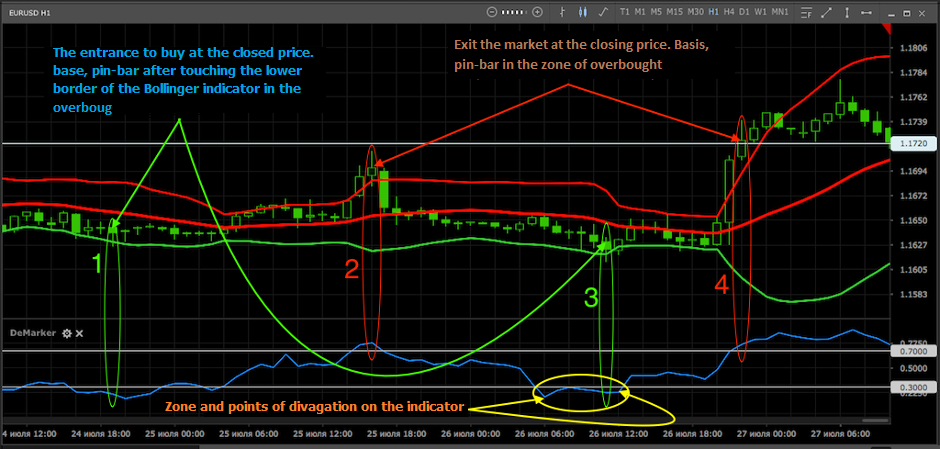
It highlighted four potential trading opportunities. Consider them as they appear.
Point 1 open a position to buy a market order at the closing price of the hourly candle. The reason for opening a position is an indicator in the oversold zone, the candle tested the bottom line of the dynamic price channel (Bollinger band) and did not break it with a close, the candle can be qualified as a pin bar (signal). Stop-loss is set below the candle shadow by 1 point. Take profit is not defined.
Point 2 a buy position is closed and a sell position is open - the base, an indicator in the oversold zone, the candle has broken through the upper border of the price channel and closed with a pin bar. Stop-loss is set above the upper shadow of the candle by 1 point. Take profit is not defined.
Point 3 The selling position is closed and the purchase is open - the basis, the candle closed with a pin bar after testing the lower border of the price channel, the indicator in the overbought zone formed a divergence with price. Stop-loss is set behind the lower shadow of the candle at a distance of 1 point. Take profit is not defined.
Point 4 a buy position is closed and a sell position is open, the indicator is in the overbought zone, the candle is a pin bar outside the price channel (price is expected to return to the channel but in this case the tape does not confirm this unconditionally, since the volatility is increased and the impulse can be continued up). Stop-loss is set one point above the upper shadow of a closed candle. Two hours later, the deal is closed by stop-loss.
On practical examples, four deals are opened based on the signals of the indicator system. Three of them closed at a profit, one at a loss. The overall result is positive.
This article provides a brief overview of the main groups of indicators and provides an example of building from them the simplest system for technical analysis