
 Russian
  中文
中文  العربي
  Bahasa Indonesia
 Divergence what it is and how to work with it
Most traders, both professionals and beginners, use divergence in their trading. Ardent fundamentalists can often speak unflattering about such technical methods of analysis. However, this does not prevent some “techies” from using divergence in trade quite successfully. Today we will try to figure out what divergence is, what types and types of divergence it is, and how useful it is in trade.
What is divergence?
The term divergence is derived from the Latin divergere, which means “divergence”. Applicable to the financial market, the divergence is considered the discrepancy between the price on the chart and the indicator. In the classic version of finding and analyzing divergences, the MACD indicator has been used for a long time. In order not to depart much from the classics, in the future all examples of divergence will be considered relative to the indications of this indicator.
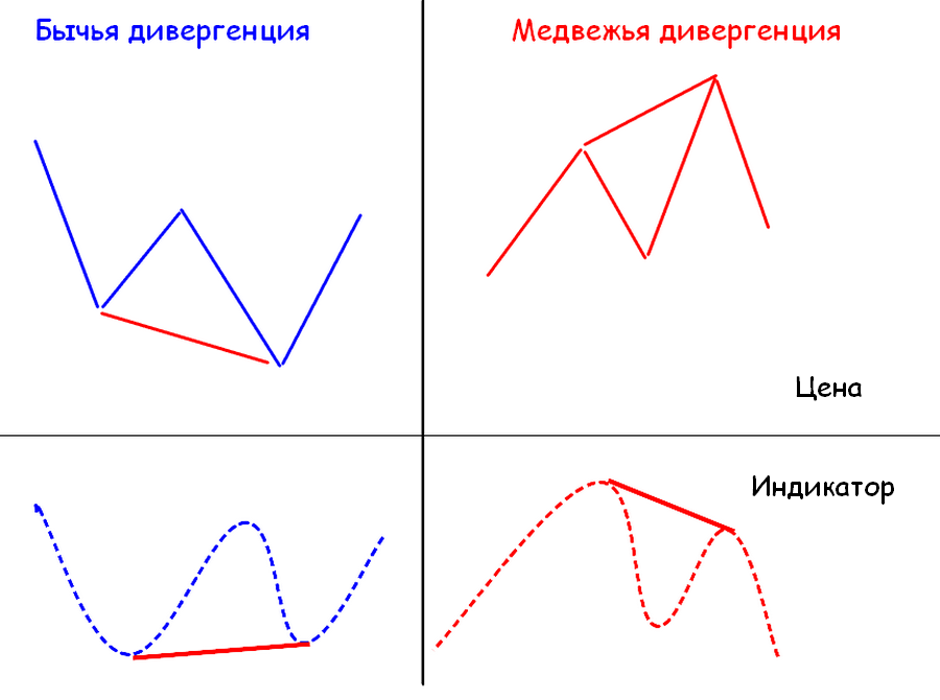
There are two main types of divergences that characterize market sentiment:
Bullish. It arises in a falling market and is characterized by a discrepancy between the falling loyas on the price chart and the indicator lows.
Bearish. It arises in a growing market and is characterized by a discrepancy between rising highs on the price chart and indicator highs.
The figure below shows both types of divergence
In addition, each type of divergence can be one of four types:
Classical
Hidden (continued).
Extended.
Triple.
Let's take a closer look at each type separately.
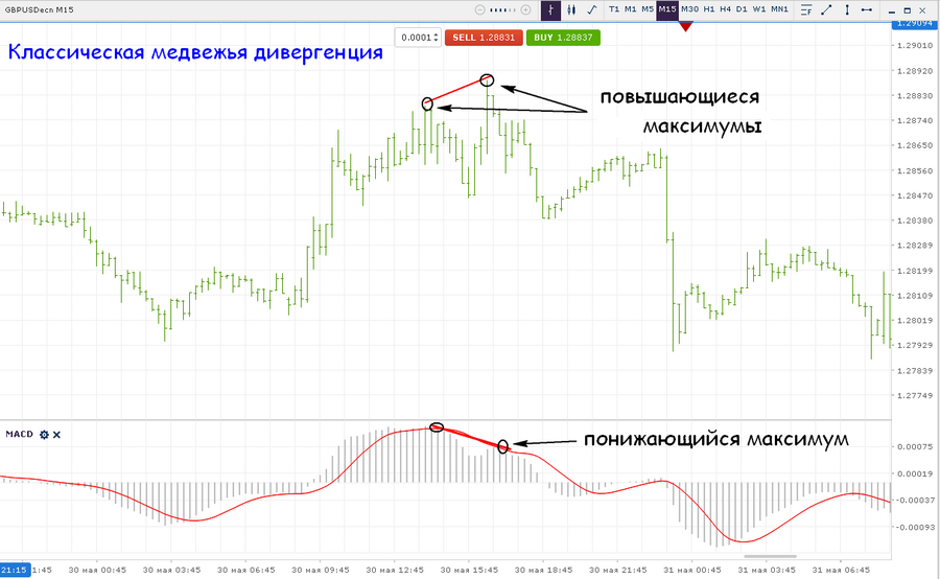
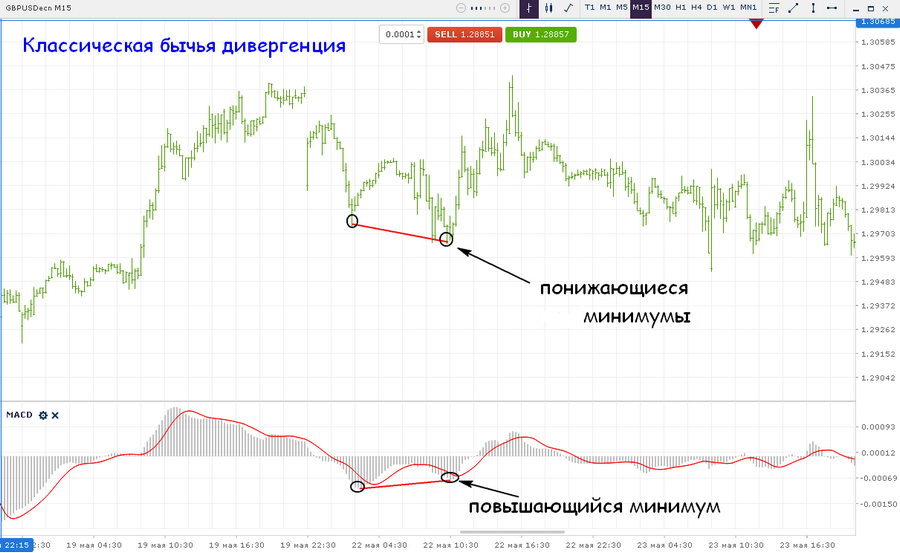
Divergence is called classical in which the first extremes coincide in direction with the indicator, and the second have a discrepancy.
So with the classic bullish divergence, two lowering loyas (minimums) are formed on the price chart. At the same time, two lows are also formed on the indicator, but in such a way that the second of them is increasing relative to the first.

In the case of the classic bearish divergence, two rising highs (maximums) are formed on the price chart. At the same time, two maximums are also formed on the indicator, but in such a way that the second of them is lowering relative to the first.
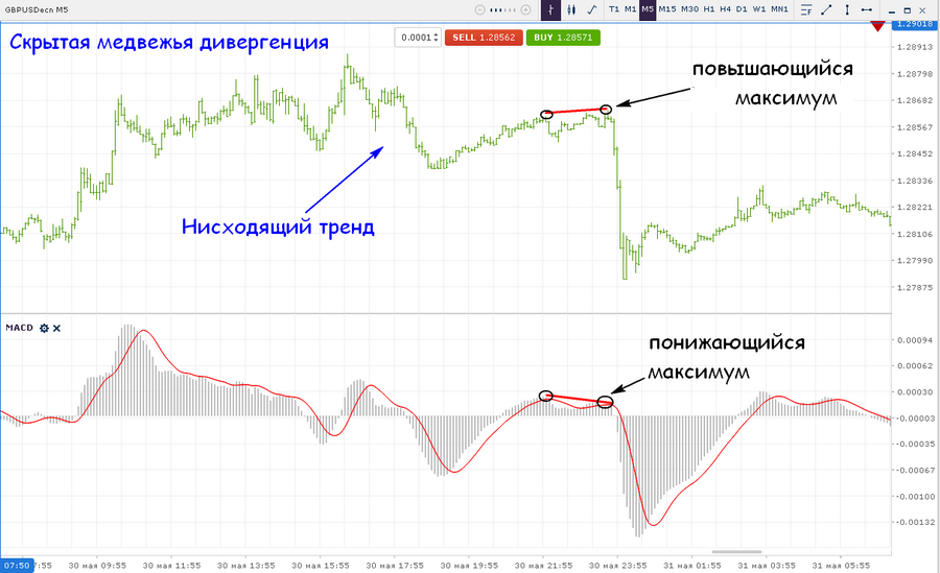
Hidden (continued) is called divergence at which a divergence of extremes is formed on the price chart and indicator readings, in the direction of the formed trend.
So with a hidden bullish divergence, on the price chart with an uptrend, two lowering loyas are formed, and on the indicator there are two lows, the second of which is higher than the first.
In the case of a hidden bearish divergence, two rising highs (maximums) are formed on the price chart with a downtrend. At the same time, two maximums are also formed on the indicator, but in such a way that the second of them is below the first, that is, it is decreasing.
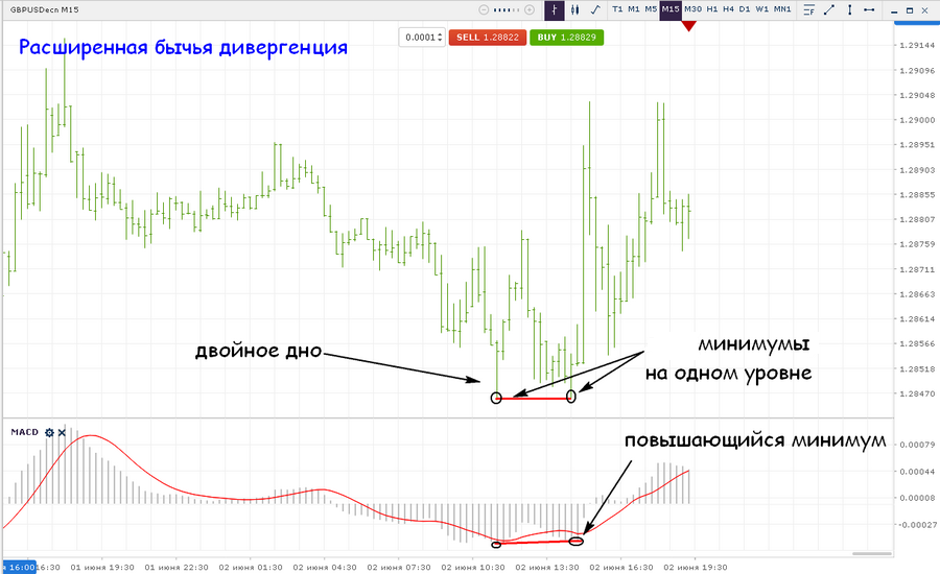
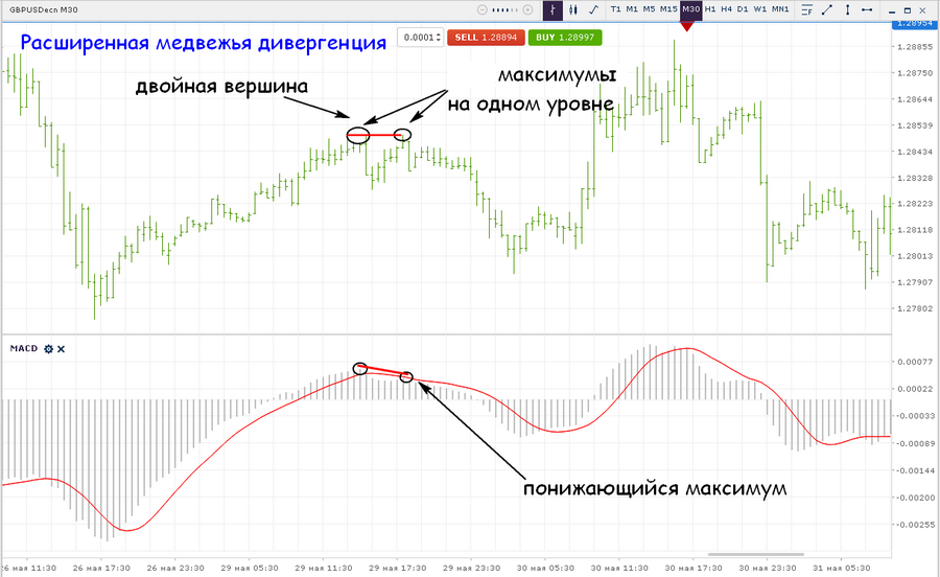
Extended divergence is called in which extremes on the price chart form a double bottom or double top, and have a discrepancy with the indicator.
So with extended bullish divergence, a double bottom is formed on the price chart (two lows are about the same level), and there is a clear discrepancy on the indicator (the second minimum is higher than the first).
In the case of an extended bearish divergence, a double top is formed on the price chart (two highs at the same level). At the same time, two maximums are also formed on the indicator, but in such a way that the second one is lowering.
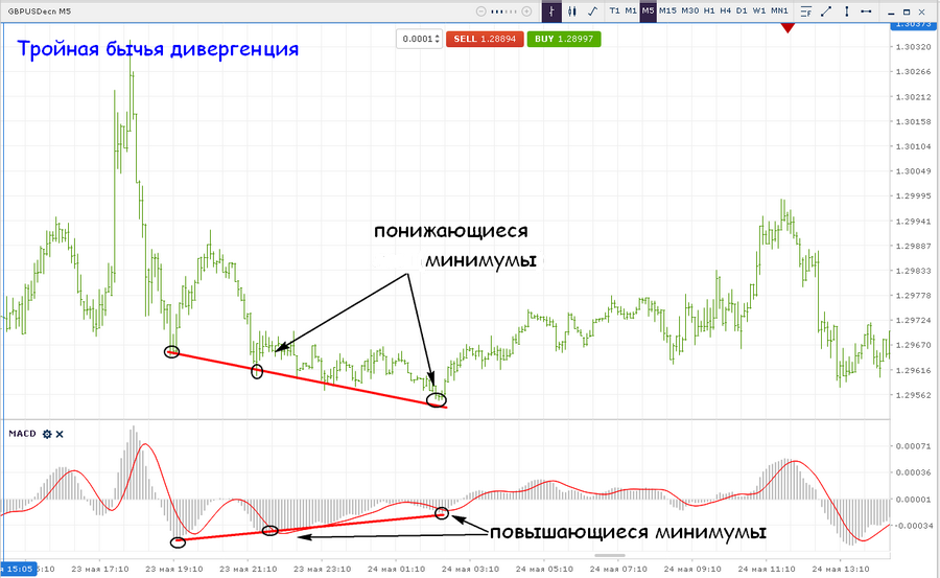
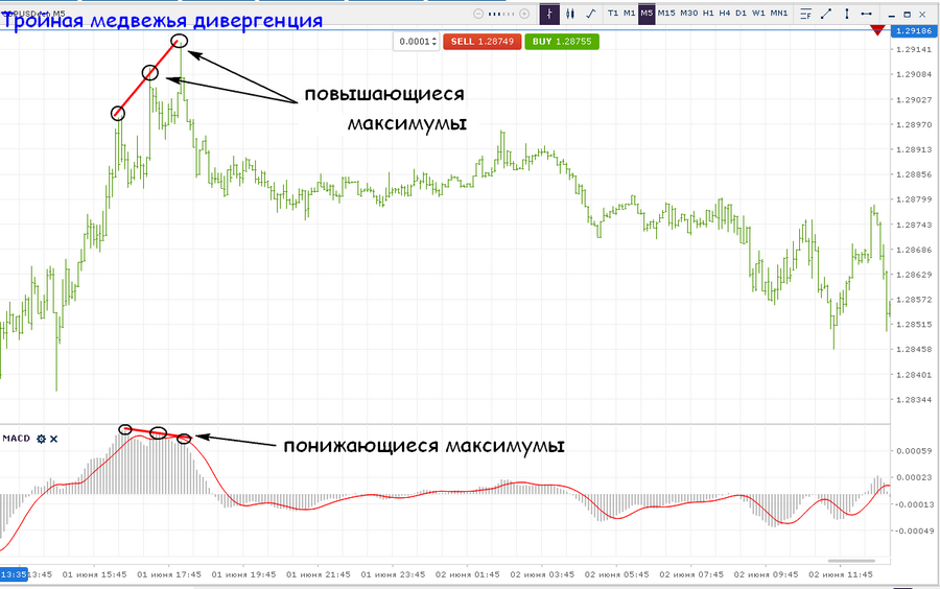
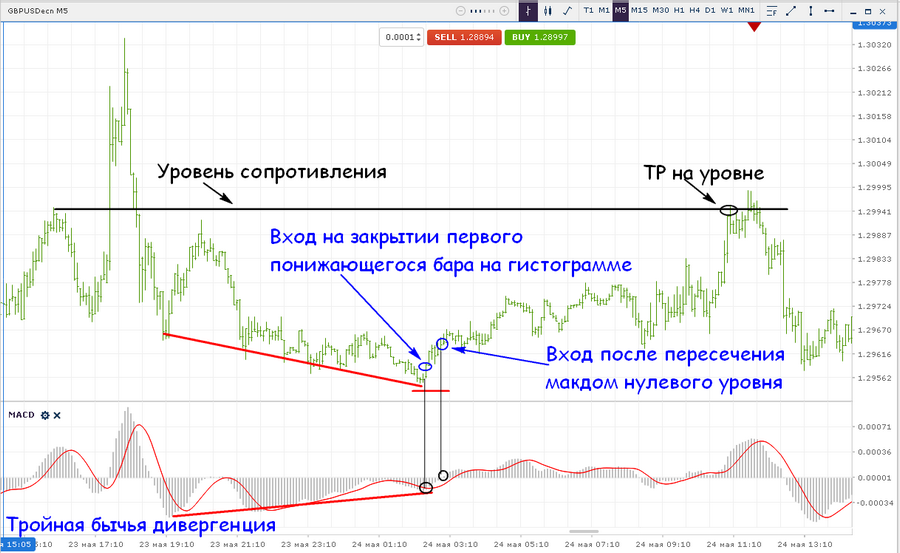
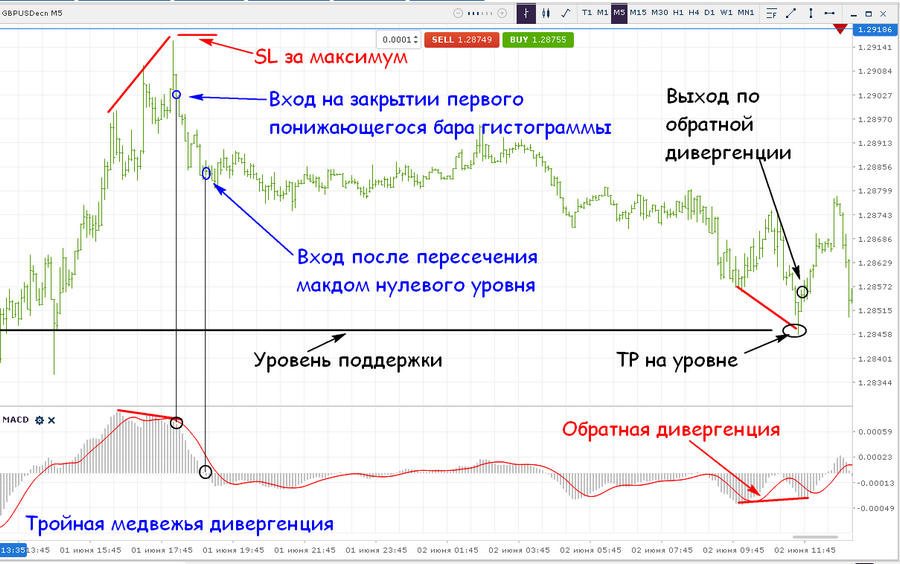
Triple is called divergence in which, instead of the classic two peaks or troughs, a discrepancy is formed between the three extremes.
So with a triple bullish divergence, three lows are formed in a row on the price chart in a row. In this case, the lows are lowering. Three lows are also formed on the indicator, but in such a way that the last two of them are rising, thereby creating a discrepancy with the price on the chart.
In the case of a triple bearish divergence, three rising highs are formed on the price chart. At the same time, three maximums are also formed on the indicator, but in such a way that the last two of them are lowering.
Options for using divergences in trade.
Now that we have understood the concept of divergence, as well as what types it occurs, the question arises of how all this can be applied when trading in financial markets.
Most of you may have noticed that in the divergence patterns discussed above, the price on the chart goes in the opposite direction from the formation of discrepancies. This is the main property of divergence, which consists in the fact that the price after the formation of the discrepancy in most cases goes in the opposite direction. Knowing this feature, you can search for optimal entry and exit points from market positions. Let's look at the possible options for each type of divergence.
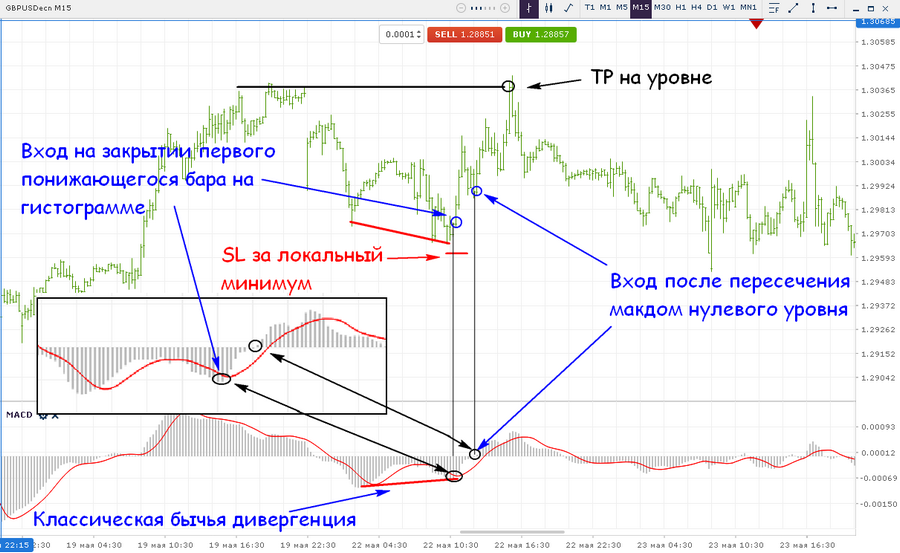
In the figure below you can see how the classic bull divergence formed.
There can be two main options for entering here:
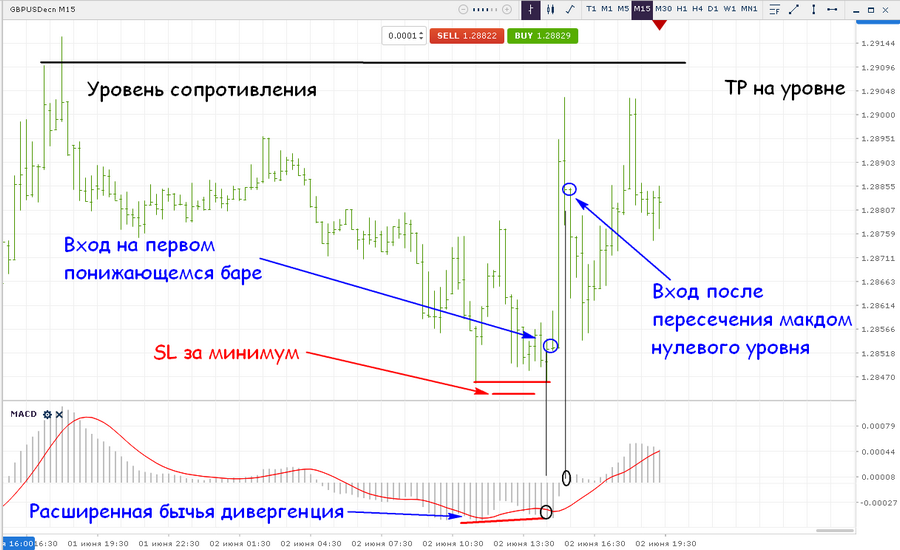
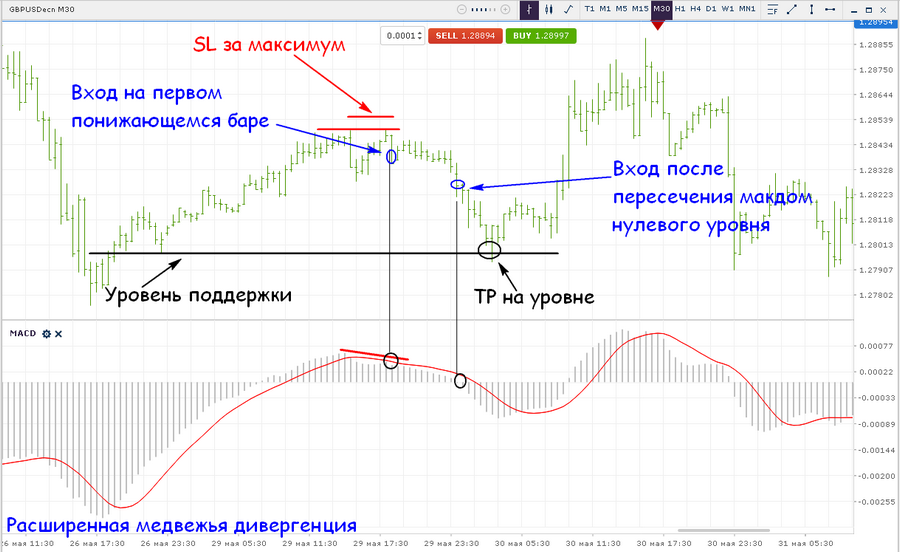
1. Entrance immediately after the divergence appears at the close of the first lowering bar on the histogram of the MACD indicator.
2. Entrance at confirmation, after crossing the MacDom level zero.
Stop loss (SL) is set for the last local loy (minimum). Take profit (TP) can be set at the nearest resistance level, or hold until the opposite signal (when a bearish divergence of one of the types appears).
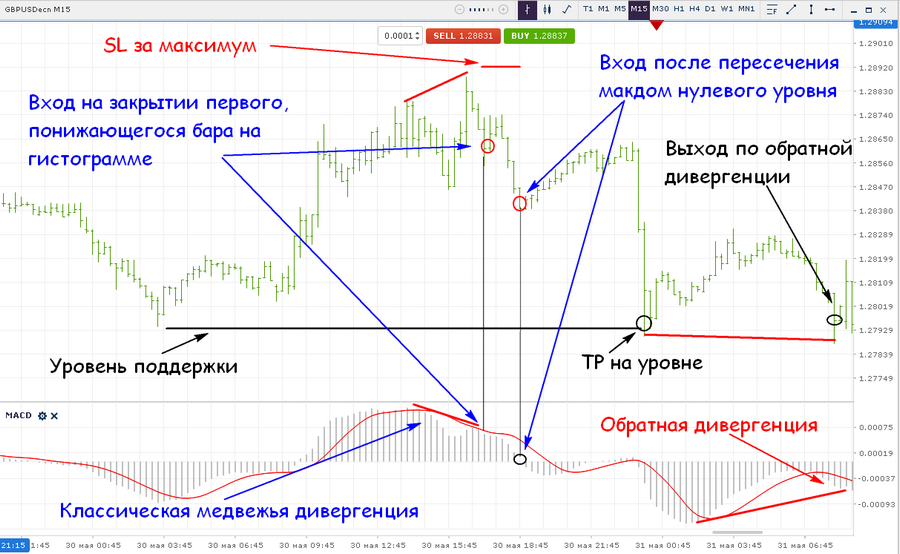
A similar operation algorithm is used when trading in classic bearish divergence. At that, stop loss is set for the last local high, and take profit at the nearest support level, or by reverse divergence.
As with the classic divergence, when trading in hidden divergence, you can use the same principles of entry and exit. Below we see how an uptrend formed, after which a hidden divergence appears, signaling a further continuation of the movement.
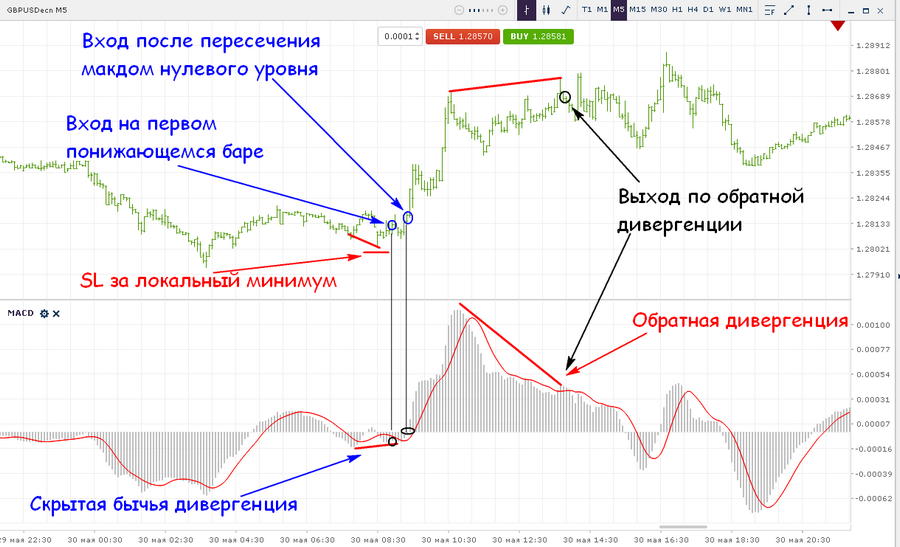
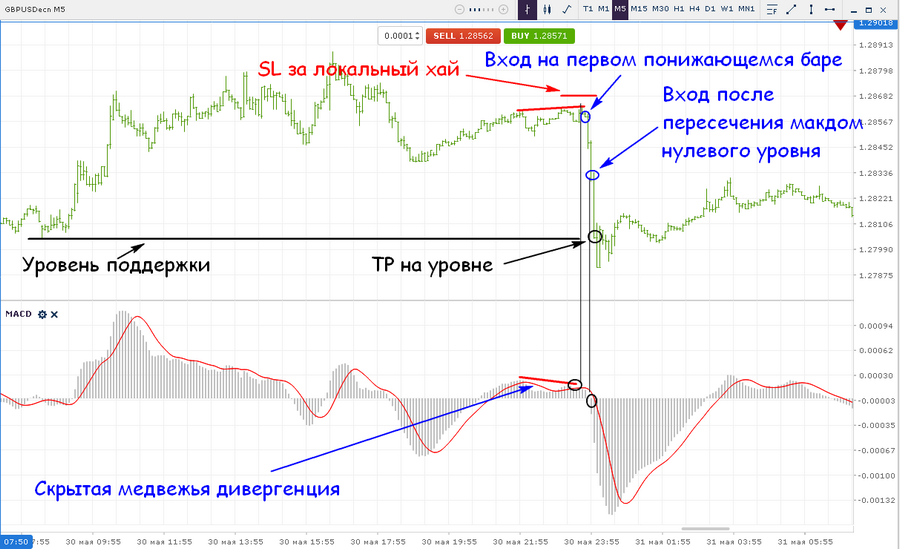
Similarly, work is underway to develop a hidden bearish divergence.
Below are options for expanding bullish and bearish divergences. Logging in is the same as when working out the previous types of discrepancies, either at the first lowering bar of the MACD histogram or at the intersection of the zero level. Exit at the nearest resistance / support level, or by reverse diver.
The work on triple divergence is similar to that considered by mining the first three types.
Testing the triple bull divergence.
Testing the triple bear divergence.
It is worth noting that work on triple divergence can often be carried out after an unsuccessful development of classical or extended divergence. Thus, even if one of the types of discrepancies is unsuccessfully worked out, it becomes possible to compensate for stop loss and get profit on the formation of a new divergence.
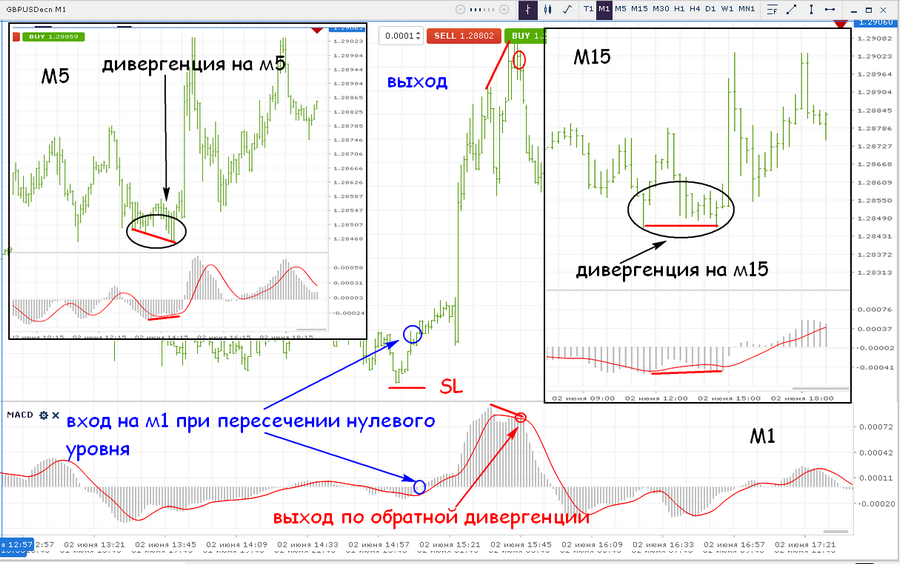
Each of the considered types of divergences can be used in a multi-timeframe format. That is, you can combine the processing of discrepancies from different time frames. Below is an example of a possible development of the divergence of a higher time frame (m15). At the same time, the entry point for mining can be done on a small time interval (m1), thereby reducing the potential stop loss and increasing the possible take profit.
Output.
Having considered what types and types of divergence can happen, as well as having examined possible options for working on it, we can say with more confidence that trading using discrepancies has great potential. In addition, the multi-timeframe use in working out any type of divergence gives a truly huge potential for profit.