Indicator-free strategies for technical analysis (Price Action)
Surely many traders have heard or read the expression “the chart takes into account everything.” And this is certainly true, because at the current time, quotes take into account all factors affecting prices in the past, present and, oddly enough, the future (again, the expression “expectation of an event is embedded in the price” is familiar to most).
From the foregoing, the question arises: if the price is primary (what is the truth) then why use indicators in trading that are essentially based on the so-called “closing prices” of the period and always lag behind what we see online? It is on this concept that the method of technical analysis called price action is based (in literal translation - price action).
Traders performing technical analysis using this technique use only the price chart without any indicators. Also, the price action technique is used as the basis for building a large number of indicator trading systems.
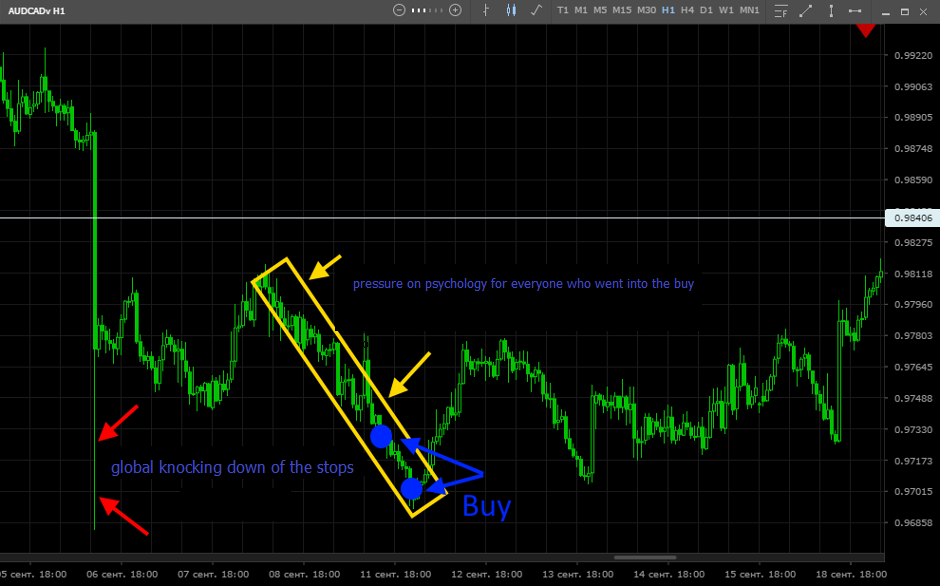
Now consider the basic principles of trading using a clean price chart. Most US traders trading only a chart use the display of prices on the chart using bars while Asian traders and most European traders use Japanese candles. It is believed that Japanese candles also show the psychological mood of market participants, and with their help it is not difficult to determine important technical levels, which are subsequently used as the basis for issuing orders to limit losses and target designation for subsequent profit taking on open positions.

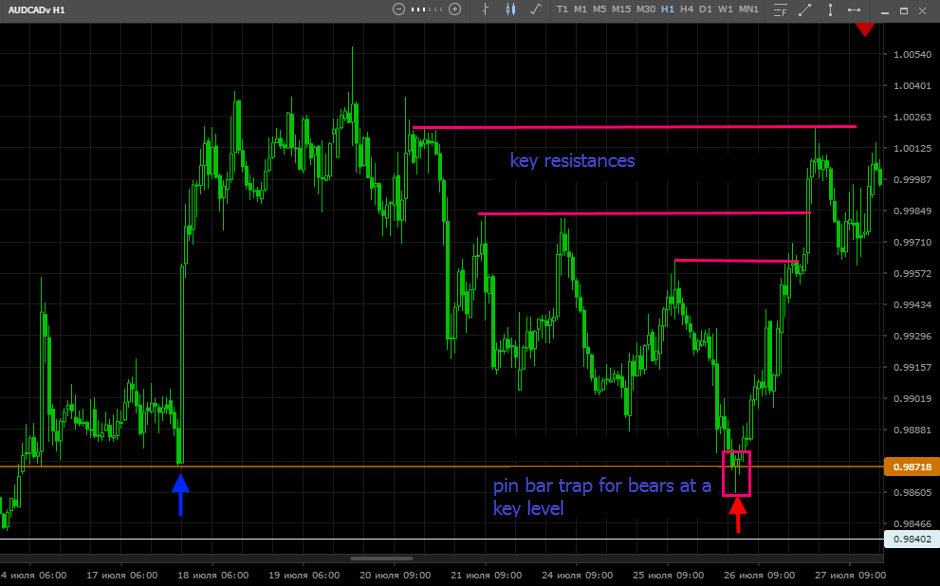
The basis for deciding whether to open a position using the price action method is various combinations of candles (or bars). These combinations are called patterns. Patterns can consist of either one or several candles. Combined with support / resistance levels and the Fibonacci extension, this technical analysis strategy is quite sufficient for trading. The latter allows one to take into account the wave component in the structure of price movement and more optimally determine the importance of the technical level at which the pattern is formed.

The price action method is most optimal when determining trend fractures and is used, as a rule, on a daily chart scale, and the immediate market entry point is determined using patterns on the hourly chart according to the structure (Н1) principle inside the structure (D1).

 Russian
  中文
中文  العربي
  Bahasa Indonesia