
 Russian
  中文
中文  العربي
  Bahasa Indonesia
 Support and resistance levels. The reasons for the formation of price levels
Traders who work with various types of assets need to understand where important price zones are located it is important to be able to determine levels where the current price direction can change. Such zones are the Support and Resistance levels, and today we’ll talk about how to determine these levels, and how they are formed. In addition, we will provide some ways to plan transactions based on these important levels.
What are support and resistance levels?
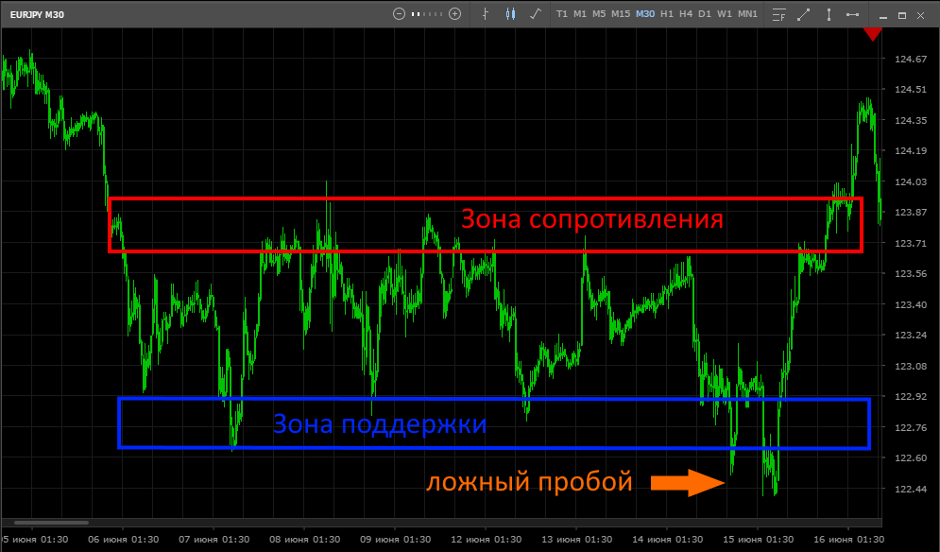
Support and resistance levels represent the boundaries of the channel in which the price fluctuates over time. These levels can be visually recognized on the chart: the Support level is the lower boundary of the price corridor, where the price turns and rises upward, and the Resistance level is the upper boundary of the channel.
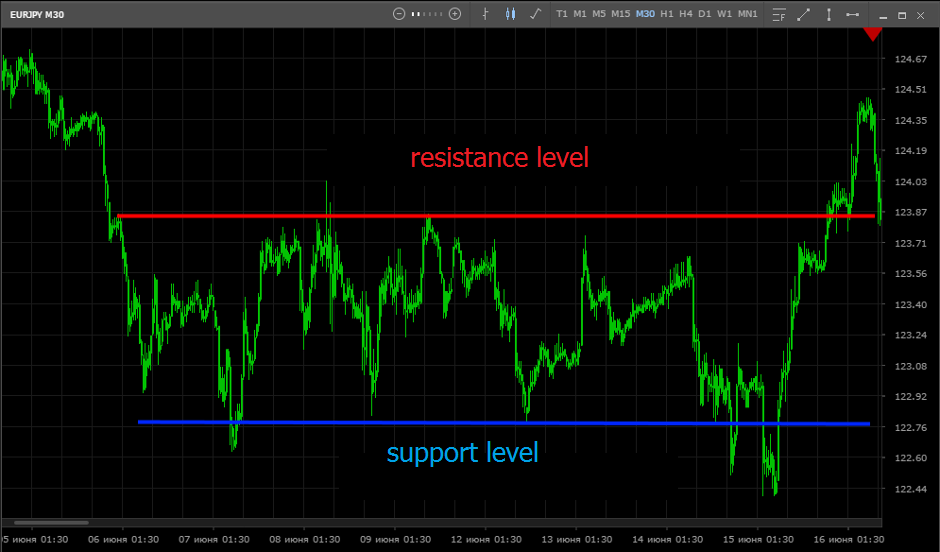
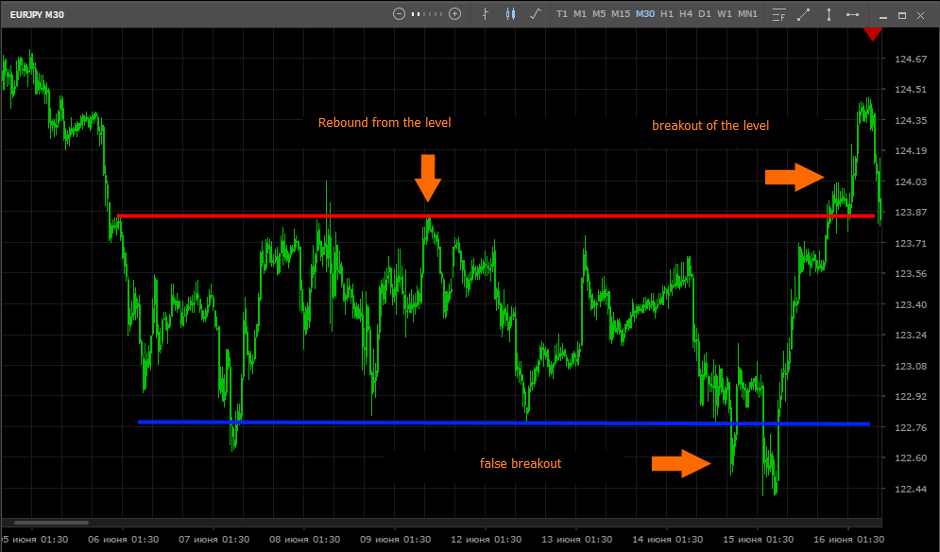
If the price breaks through one of these boundaries, there is a probability of a trend developing in this direction, and if the price bounces off this boundary and confidently reverses, then there is a probability of a side trend continuing. However, the breakdown may turn out to be false, and after crossing the level, the price again returns to the range:
It must be understood that support and resistance levels are only relative to a certain range and current prices. For example, as soon as the price leaves the channel borders, crosses the resistance level and begins to form a new range, in this new range the resistance zone automatically turns into a support zone.
Support and resistance. Lines or zones?
Despite the fact that the boundaries of the channel are often indicated by plotting solid horizontal lines (at a certain price) on the chart, it should be understood that the lines themselves cannot be taken as clear boundaries of the price corridor. In other words, a certain price cannot be considered a channel boundary. Rather, the lines indicate only the approximate location of some areas in which a trend change is likely.
When approaching the borders, the price may make false breakouts or turn around without touching the line. Therefore, some traders prefer to mark each level (support and resistance) with two lines, the distance between which is the border of this same zone or highlight this zone with color.
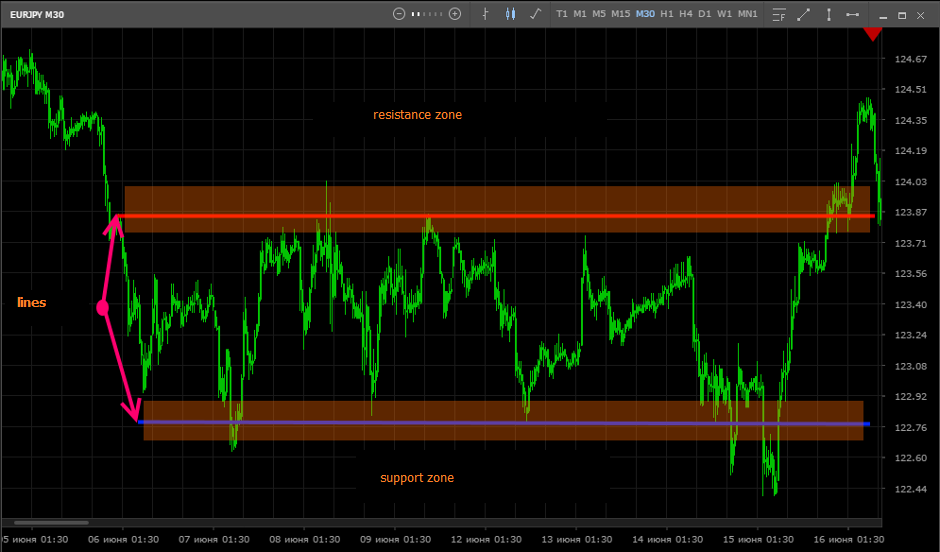
Accordingly, it is preferable to place pending orders and stop orders outside the boundaries of the zone, and not behind the very line of the price barrier. To determine the border, you only need to draw a line that connects all the lows at the lower border (and all the highs at the top), and in order to determine the support and resistance zones, you need to carefully analyze the price behavior at the previous highs and lows.
Factors of formation of support and resistance levels on different timeframes
Side trends can be observed on all timeframes from minimum to maximum. Accordingly, within each time period, you can determine the boundaries of the channel and work inside it, observing the behavior of the price near the borders. However, the following circumstance should be taken into account: the smaller the timeframe, the more likely the channel will break due to market reaction to the publication of important economic news.
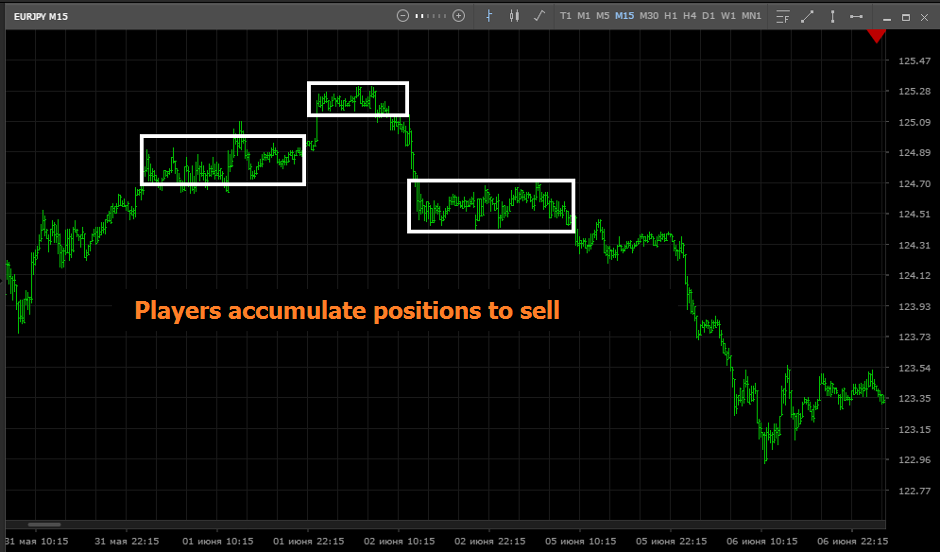
In the long term, the price of an asset can be artificially kept in a range, for example, the exchange rate of a national currency can be regulated through interventions large purchases or sales by state funds. The lateral observed on hourly charts may be due to the fact that large players are gaining positions in order to move the market up or down. The price movement in a narrow channel during the day may be due to the expectation of important news that will be published only tomorrow. In other words, you need to consider what factors can affect the market on a certain timeframe (or several)
What happens near support and resistance levels
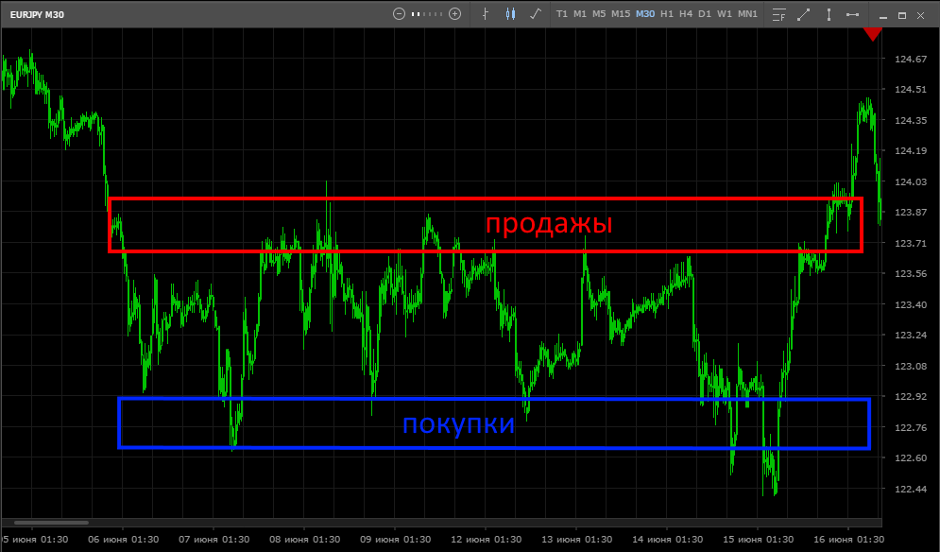
What happens when the price has formed a side range? Due to the lack of fundamental prerequisites for raising or lowering prices, players are waiting for a trend to form. The largest number of orders accumulates near the borders some players expect a breakthrough and place orders outside the sidewall, and those players who believe that the price will remain in the range place orders within the range.
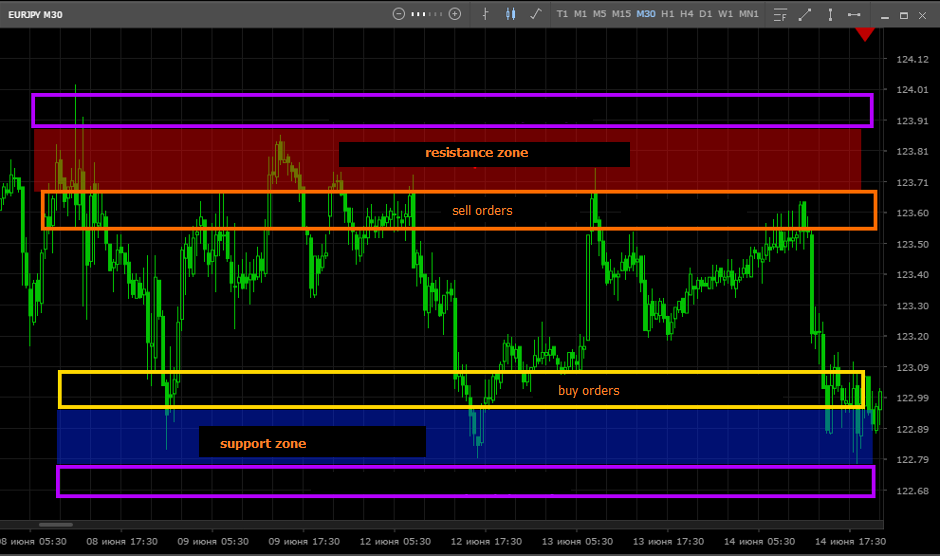
If the market cannot absorb all the orders within the corridor (up to the border), then the price will not be able to move on and will return to the opposite border of the corridor. If the price leaves the corridor, it will be met by applications placed abroad, and can be supported by applications of those who are expecting a trend, as well as stop-loss players who set to continue sideways.
False breakdowns are often present at the channel’s border large players absorb applications in order to understand how the market is configured to support movement. If most players do not believe in the continuation of the trend, the price returns to the side. However, the price return may also turn out to be false, the price can touch the border and rush up again, which is one of the classic signs of a trend development.
After the publication of economic indicators, the market begins to win back information depending on the expectations of the players. In the subsequent movement of quotes (up or down), a scenario is realized that was reserved by investors in case of publication of precisely such indicators that appeared in the news. Especially powerful trends arise when published indicators differ significantly from expected ones (indicators can be much higher or lower).
How do the players of various "weight categories" act sideways
Players take part in market trading, which can be attributed to various categories. The differences are determined, first of all, by the volume of resources that the players operate on, as well as the timing of the investment. To better understand why the price in the lateral range behaves in one way or another, and what can be expected in the next moment, it is advisable to know who and how is trading in the market. For this, it is necessary to identify possible goals that market bidders who can belong to different categories of players can pursue:
Major players
This category includes investment funds, banking networks, during lateral movement they accumulate positions for buying or selling. As orders are collected at the right price, they trigger a trend movement, at the end of which positions are sold and profit is recorded. Positions in any direction can be gained both in the upward movement and in the downward movement. For example, with an uptrend, there may be several sideways, after which the price will rush down.
If, for example, there are prerequisites for an uptrend, players try to make their purchases from the lower border or in the middle of the range. Such players often manipulate the market using various tricks. For example, sometimes there may be a “probing of the level” false breakdowns during which the “market mass” (most players) close their purchases and open sales, thinking that the market has rushed down.
Private investors
These are traders who operate on their own funds and cannot see how large were the sales and purchases at various price levels. Therefore, in the side view, they are guided by the general rule “Sell more expensive and buy cheaper”, that is, they buy at the lower border (placing stop loss below the support zone) and take profits near the upper border. In the same way they act when the price is near the upper border of the corridor.
In the event that the price sharply fights off the resistance level, sales are made (stop loss above the border) and profit is fixed at the bottom of the range. If the position is closed by stop loss, they suffer small losses, and if the price goes to the opposite border, they fix a good profit. In addition to speculative profit in long-term stock transactions, they have the opportunity to receive dividends.
Short term players
Such players do not have large capital, therefore they can not make long-term and medium-term transactions, since long waiting with a small amount of investment cannot bring any serious income. Accordingly, their strategies involve frequent short-term transactions. These are traders who use every opportunity to enter the market and they do not always buy and sell where players from other categories enter the market.
Quite a few short-term players make classic mistakes. For example, a trader may well sell an asset at the upper border, thinking that an uptrend will begin now and puts a stop loss at the lower border. As a result of this approach, it is likely to get a small profit (in the case of a true breakdown) and a large loss in the case of an incorrect forecast. A small profit will be due to the fact that after the breakdown, the price often tests the border from the other side, and the trader, seeing a reversal, quickly closes the position, out of fear of losing. At the same time, the loss (by stop-loss) can turn out to be significant, since the newcomer is likely to hold the position right up to the border of the corridor.
Corporate traders
Another category of players is traders who purchase or sell assets (or derivatives), which are a “working tool” for the activities of an investor corporation. Such players are more interested in buying (selling) an asset at the best price, they are much less interested in speculative profit. Players of this type include various funds and corporations that allocate (temporarily or permanently) part of the profit in market assets.
For example, Nestle makes purchases on the commodity market, when buying large quantities of sugar and coffee beans, the price of this asset rises up, capturing futures quotes. Apple is selling a large lot of dollars, converting them into Chinese yuan to settle accounts with local companies that manufacture components for their digital technology in China. Accordingly, at this moment, the dollar against the renminbi is declining. The Pension Fund can place capital (formed by contributions) in shares, this protects money from inflation and allows in the future to ensure payments from the sale of securities and dividends received during this time.
Strategies for working with support and resistance levels
Regardless of the timeframe on which the price has moved to the side trend, you must first wait until the channel is formed. For several highs and lows, it will be possible to clearly define support and resistance zones. There are two core strategies for working with these levels:
Level Breakout Game
If there are prerequisites (for fundamental or technical analysis) for the breakdown of the level, the trader enters the position. The lot is bought or sold in the market when the price has approached the point of support or resistance (or it places a pending order that will work during the breakdown). In this case, the stop loss is usually set close to the entry point. The reason for closing a market position is a price reversal before touching the zone, respectively - take profit is set outside the range.
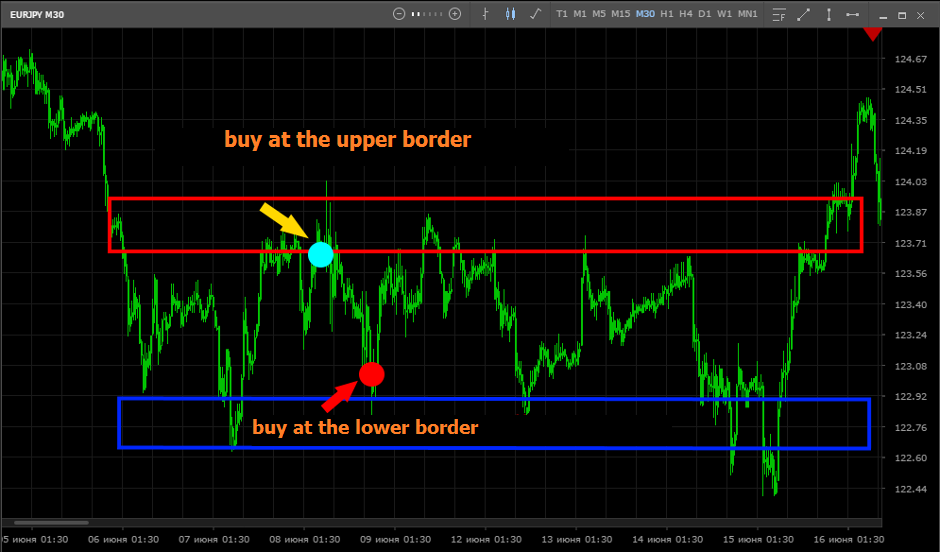
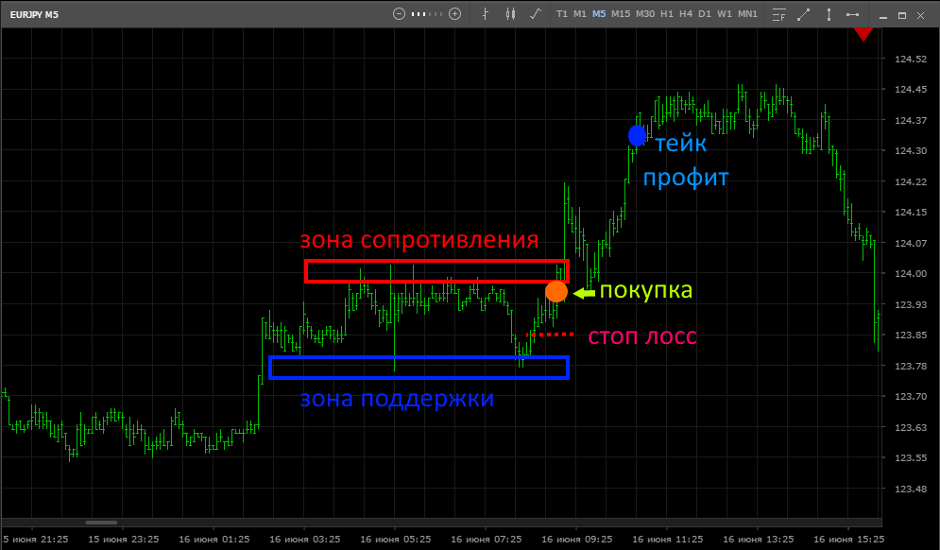
Game to hang up from the level
If the trader believes that the price does not leave the channel, then near the border he opens a position in the direction of the opposite border. Stop-loss, as a rule, is set at the maximum that the price has reached for the entire duration of its stay in the range (so that the transaction does not close on a false breakdown). Profit in such a strategy is recorded in the lower part of the range, if there was a sale from the resistance zone, or in its upper part, if there was a purchase from the support zone.
Conclusion
When working with support and resistance levels (especially when trading on lower timeframes), it is worth remembering that on news the price can easily break through the level and can also easily return to the range. At such moments, the risk of suffering losses increases, therefore it is better to refrain from trading on the news, unless, of course, the trading system does not involve playing on the news.
In addition, a trader should think about where the levels at which most players will place stop-loss levels are, think from the point of view of large investors who are interested in “collecting” these stops. This must be done in order to set your stop loss at the point where the risk of its absorption in case of a false breakdown (in the support or resistance zone) will be minimal.