
 Russian
  中文
中文  العربي
  Bahasa Indonesia
 Forex Indicator Strategy
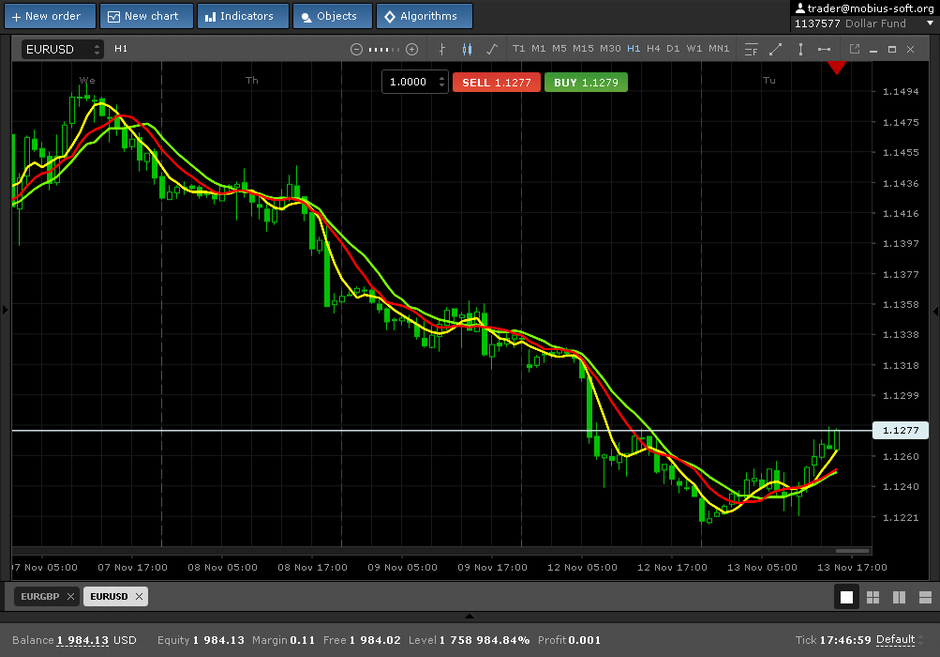
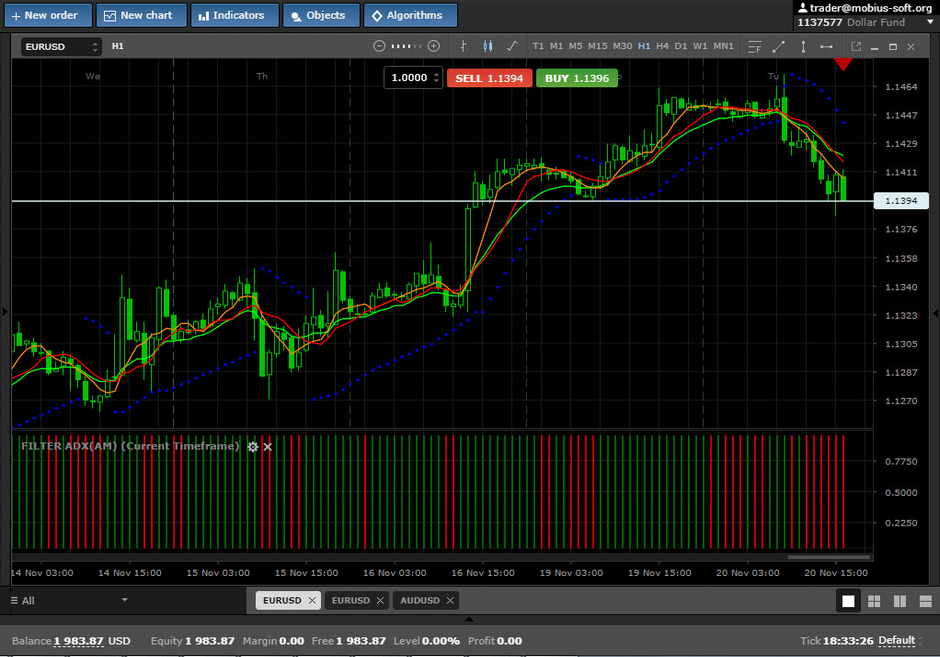
We present to your attention "Forex Indicator strategy" which trade is based on mid-term forecasting of the price. In trade it is possible to use any currency pair. And the best of all is the time period H4.
To trade on this strategy it is necessary:
1. To set the EMA indicator which is in the section Indicators-Trend
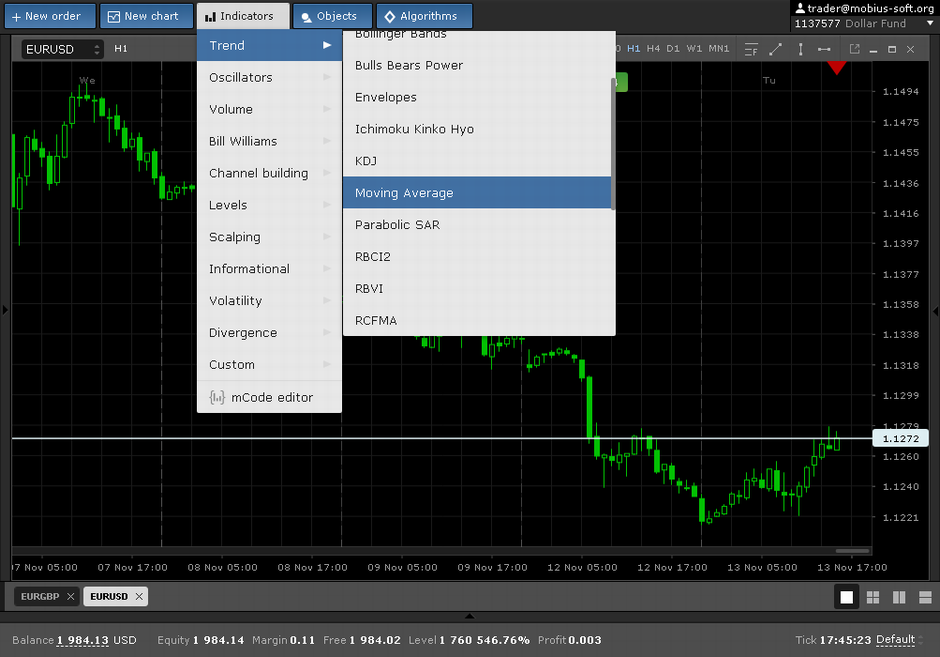
of green color with settings of the period - 12.
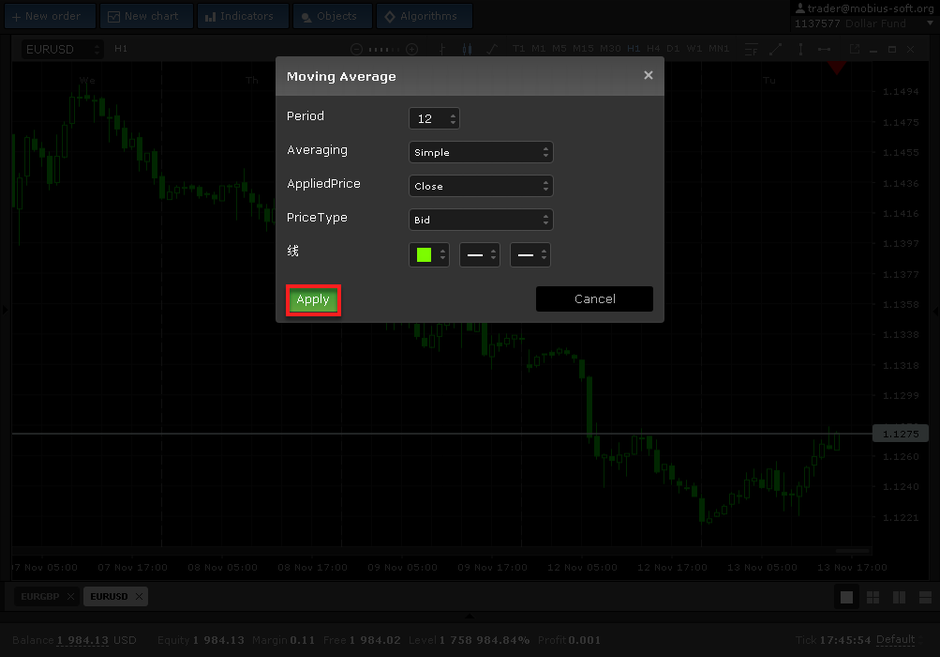
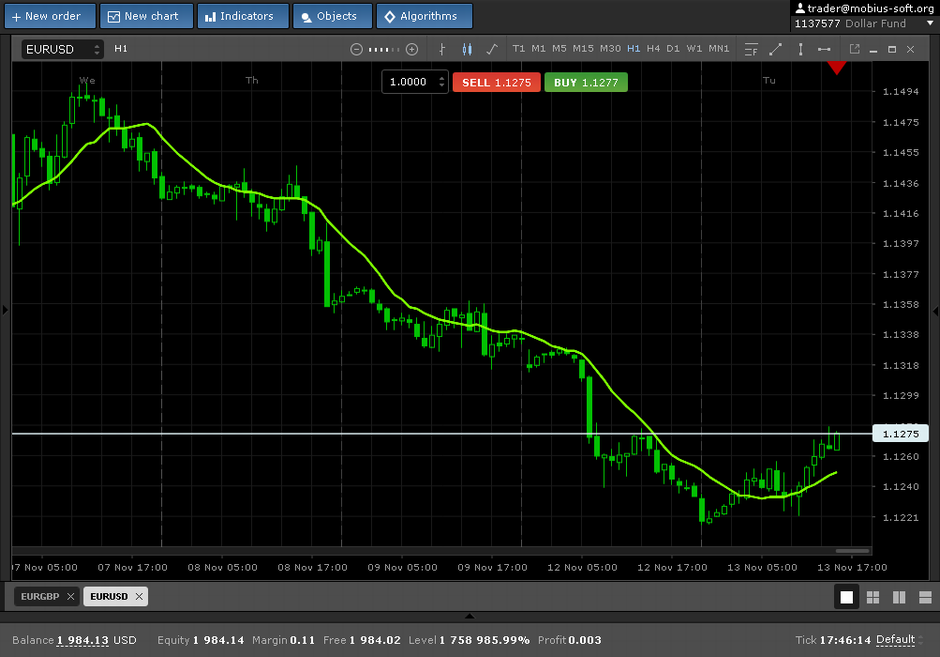
On chart it looks approximately like that:
2. To install the EMA indicator of orange color with settings of the period - 5.
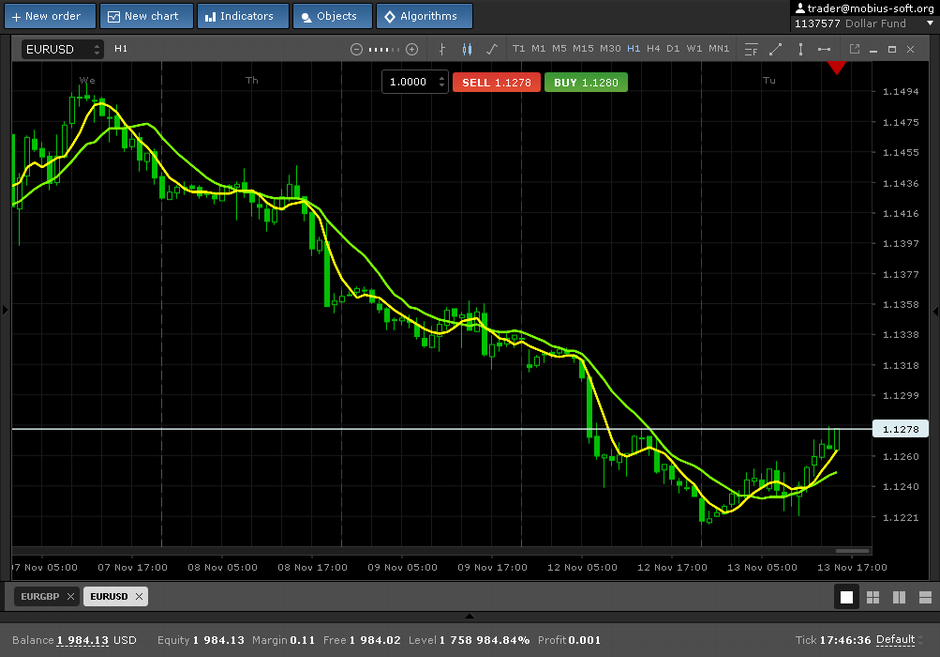
3. To install the EMA indicator of red color with settings of the period - 9.
4. To install the Parabolic SAR indicator which is also located in the section "Trend"

with default settings
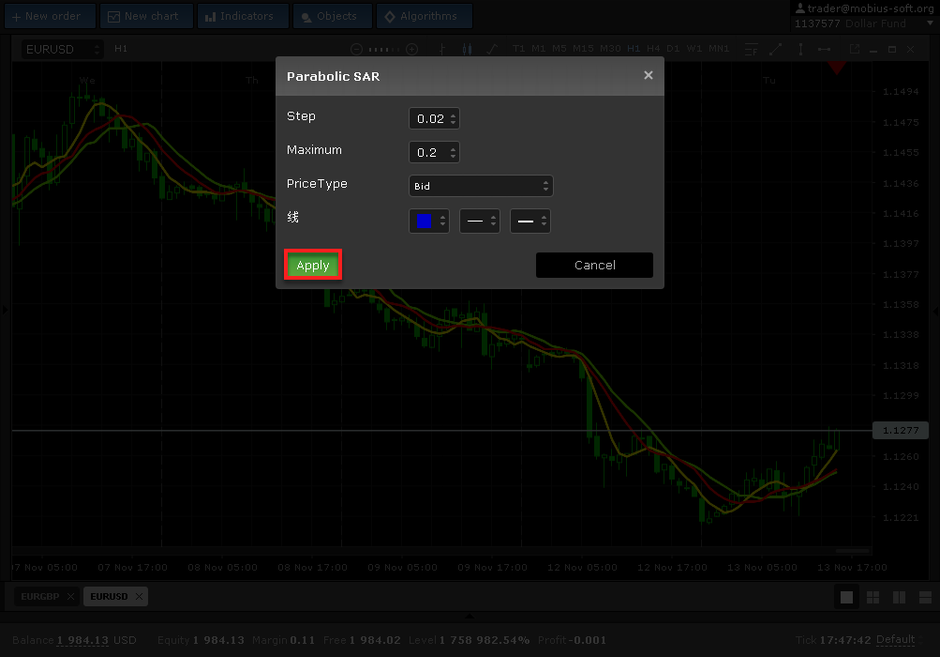
It looks like that on chart

5. To install the FILTER_ADX indicator from the section "Information"
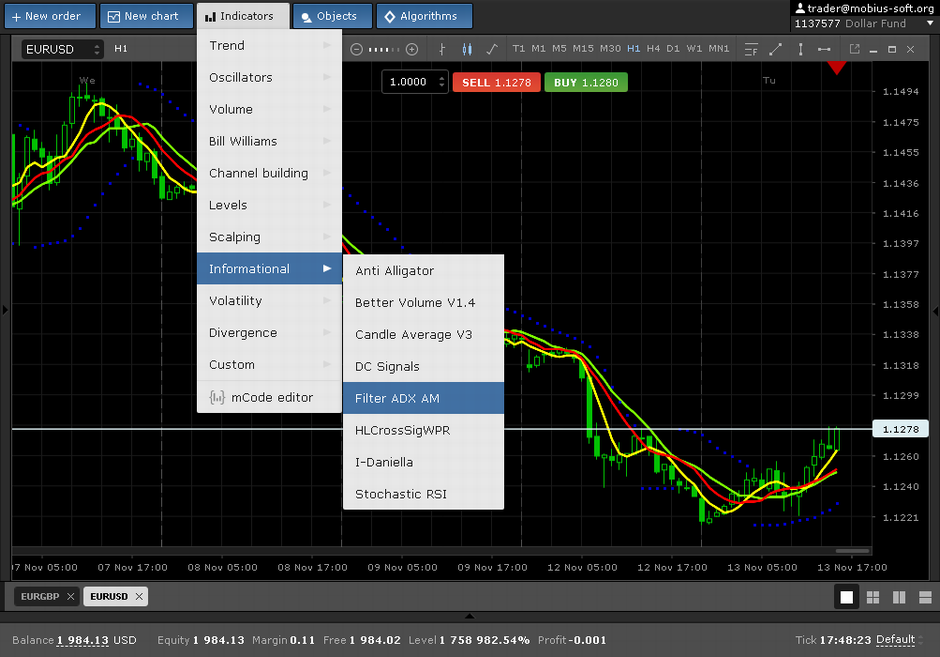
with the period 9, as shown on chart.
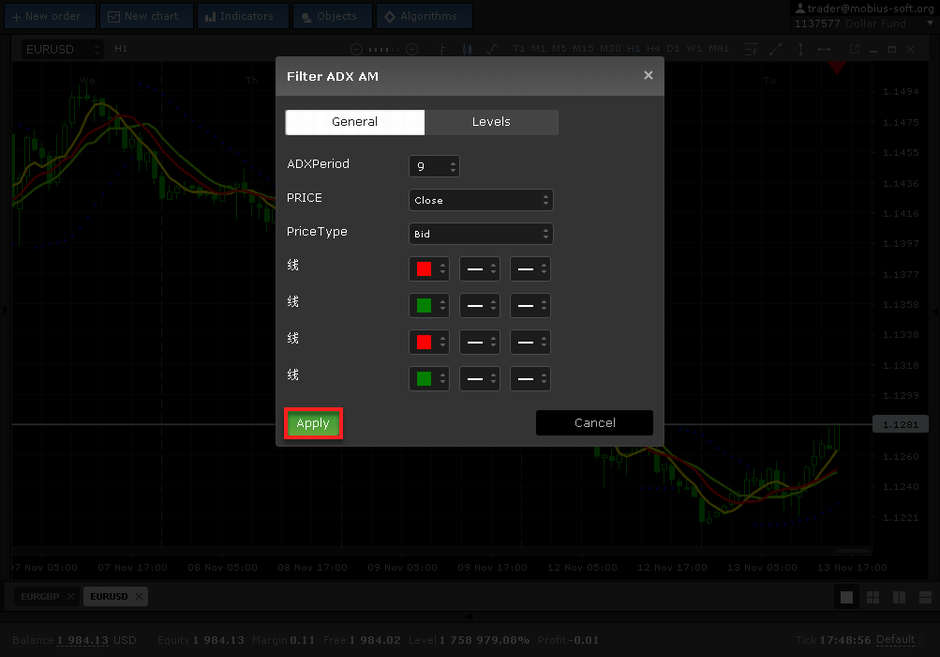
On the chart of currency pair it looks in the form of the red-green histogram.
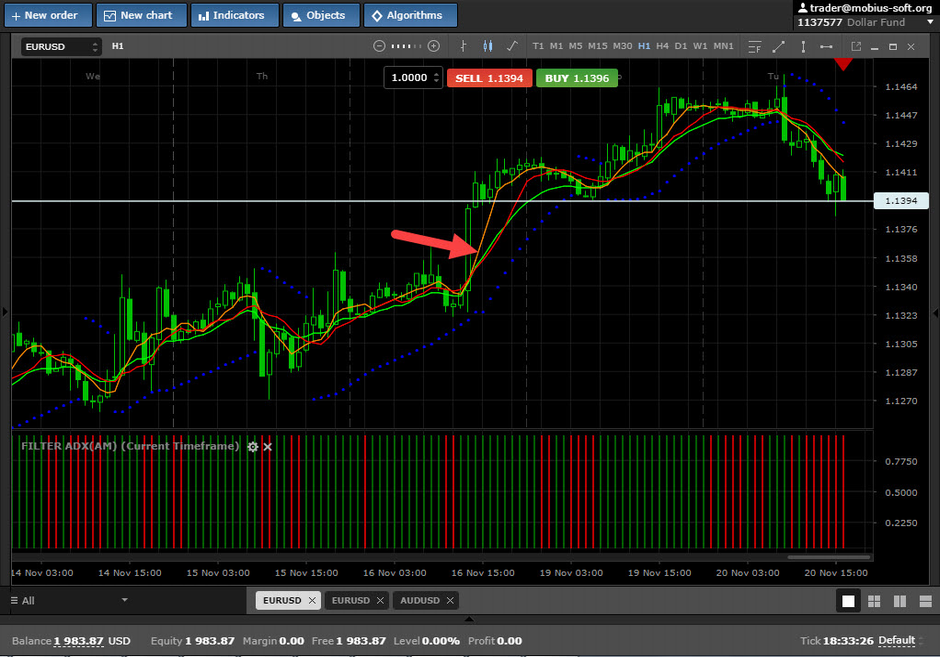
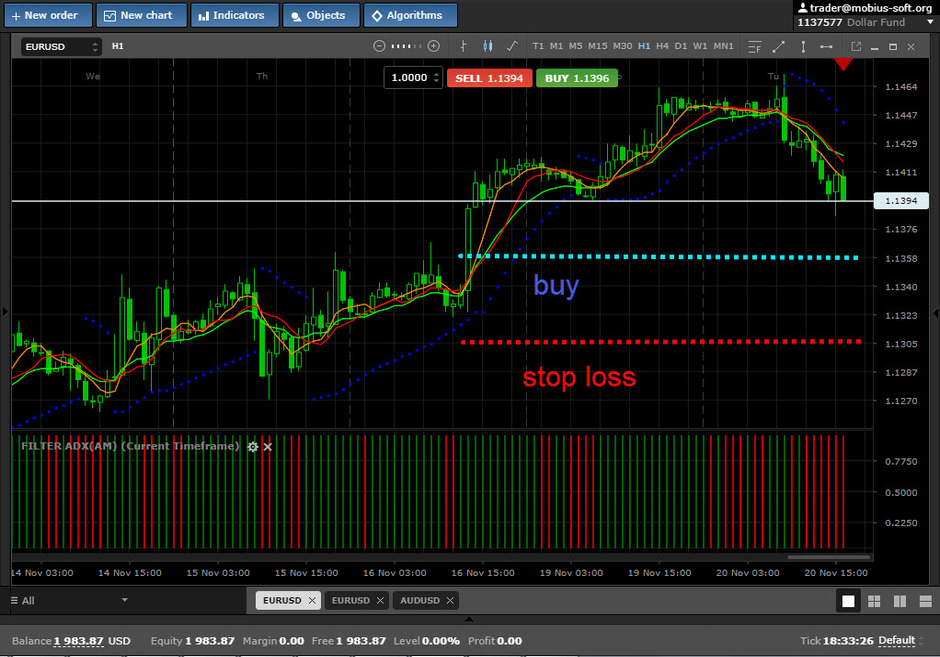
Necessary conditions for transaction on Buy:
1. It is necessary the moment when the price is above all moving averages, and also the green line shall be higher than orange, as shown on pic.
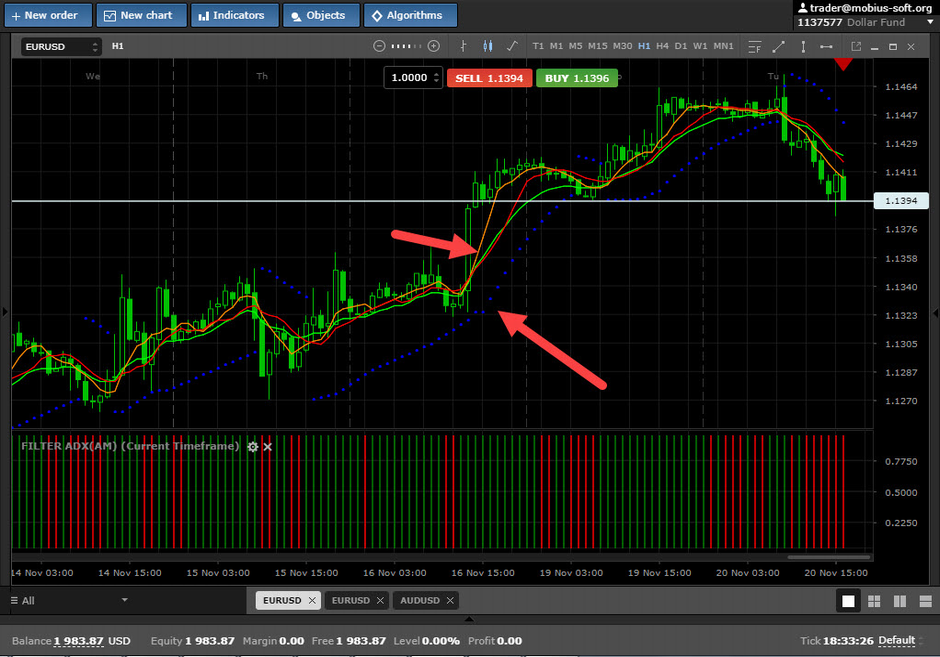
2. After the first condition and its working off in the same time the point of the Parabolic SAR indicator shall be under the price chart.
3. It is also necessary that the FILTER_ADX indicator should be bright green color.
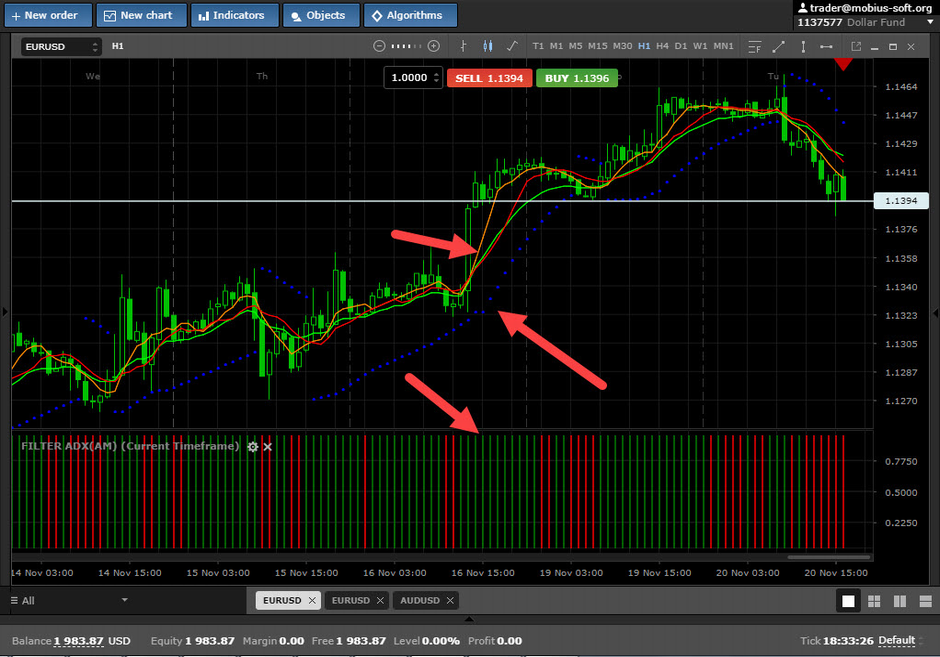
As soon as all these conditions are carried it is possible to open the order for Buy on the following candle. The maximum loss should be set from 50 to 100 points depending on currency pair.
For closing of position it is possible to use a traling stop or a no-loss. The profit in this strategy is better not to set, but if without it is very difficult, then it needs to be exposed not less than twice more than stop loss, as shown in the image below.
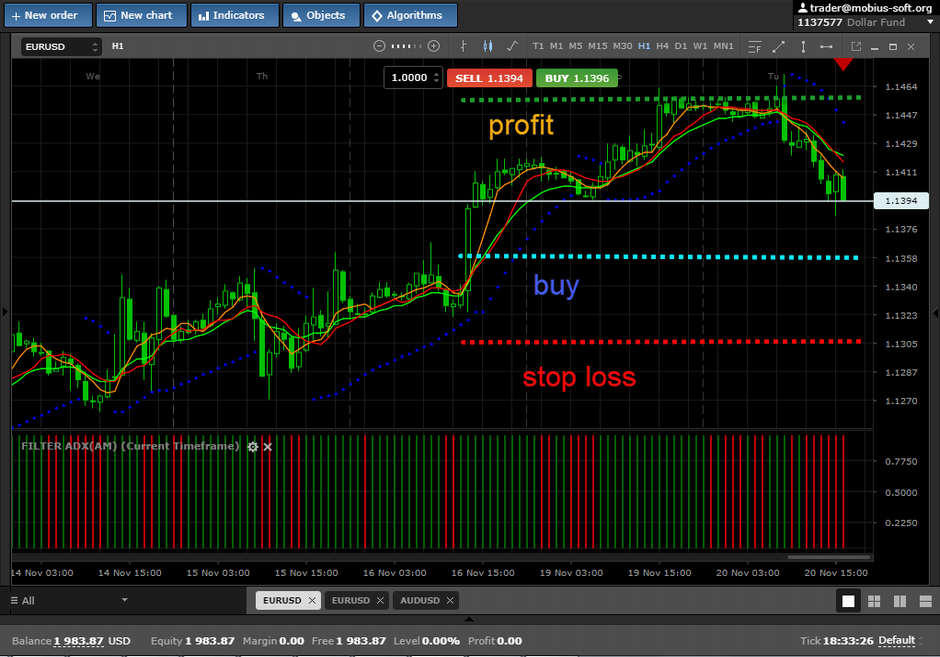
Also for closing of profit or calculation of the movement it is possible to use Fibonacci's grid.
We wish you success in trade.