Moving and SAR Strategy
Let's view a rather simple strategy based on three moving averages and the indicator Parabolic.
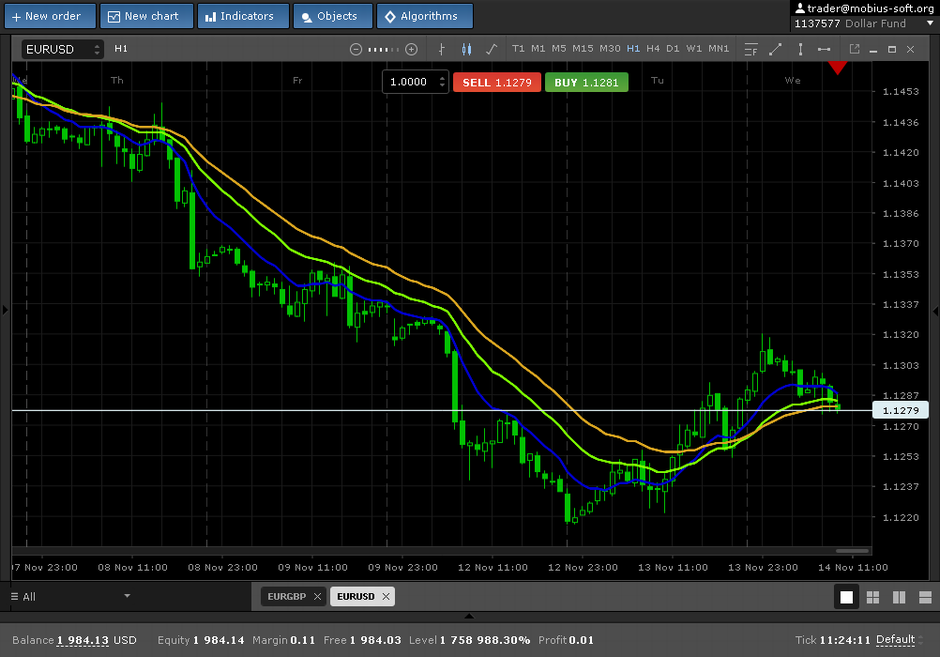
Let's set the first moving average. Click the button Indicators and in the menu we should choose Trend - Moving Average. Set the Exponential type with a period 10. In the same way set two more averages with the periods 20 and 30, as shown at the pic. below.
Further we should click the button Indicators at a toolbar and in the appeared menu we should choose Trend - Parabolic SAR
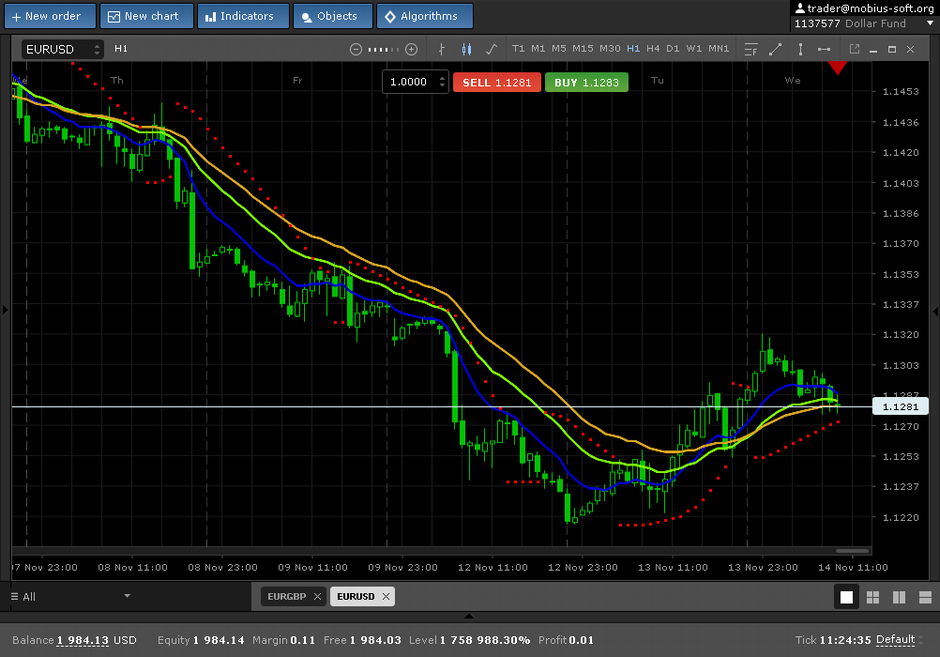
The Strategy is rather simple. We enter the transaction while lines are built according to the periods.
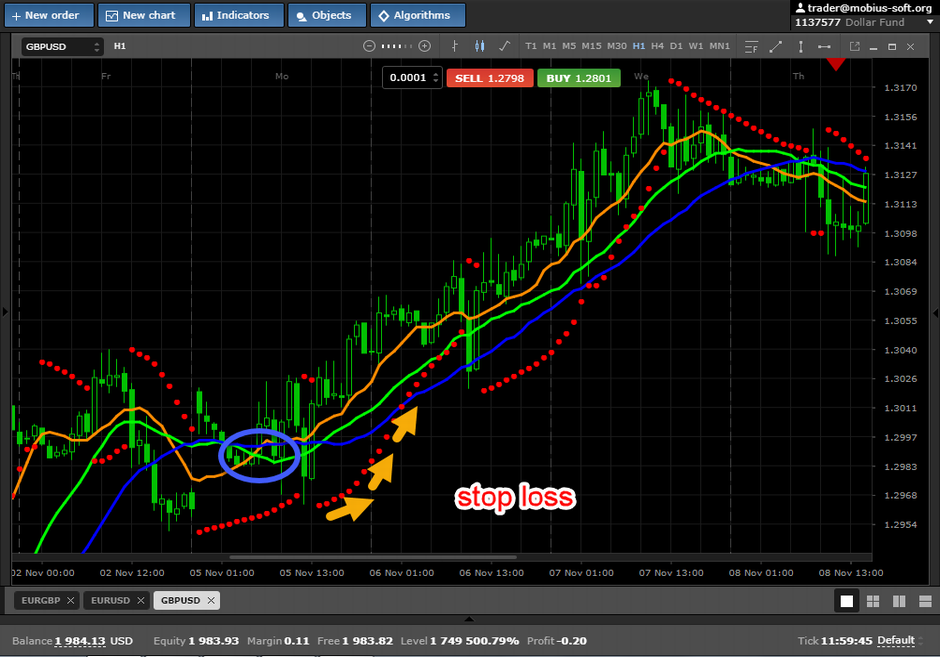
So the signal on Buy happens while average with the smallest period, crosses the second average from below up,
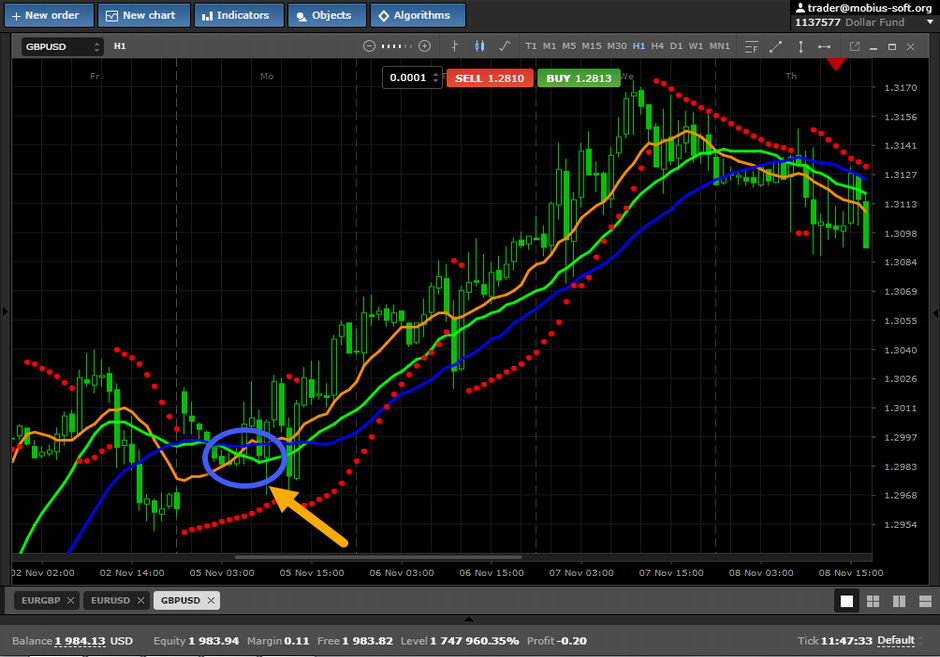
and at the same time the indicator Parabolic and average with the greatest period is under them.
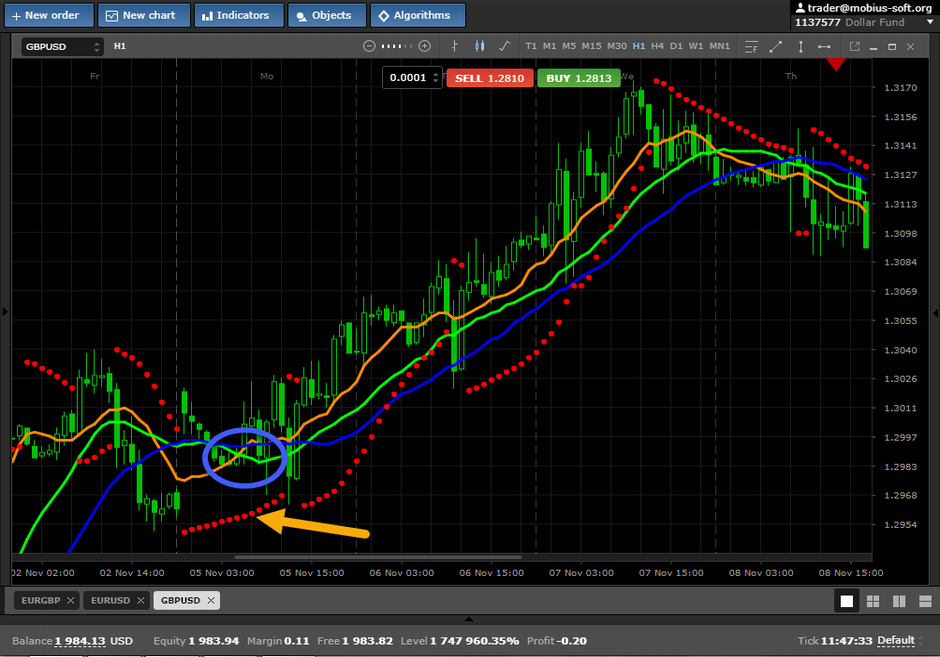
And on the contrary, the signal for Sell happens while the average with the smallest period crosses the second average from top to down
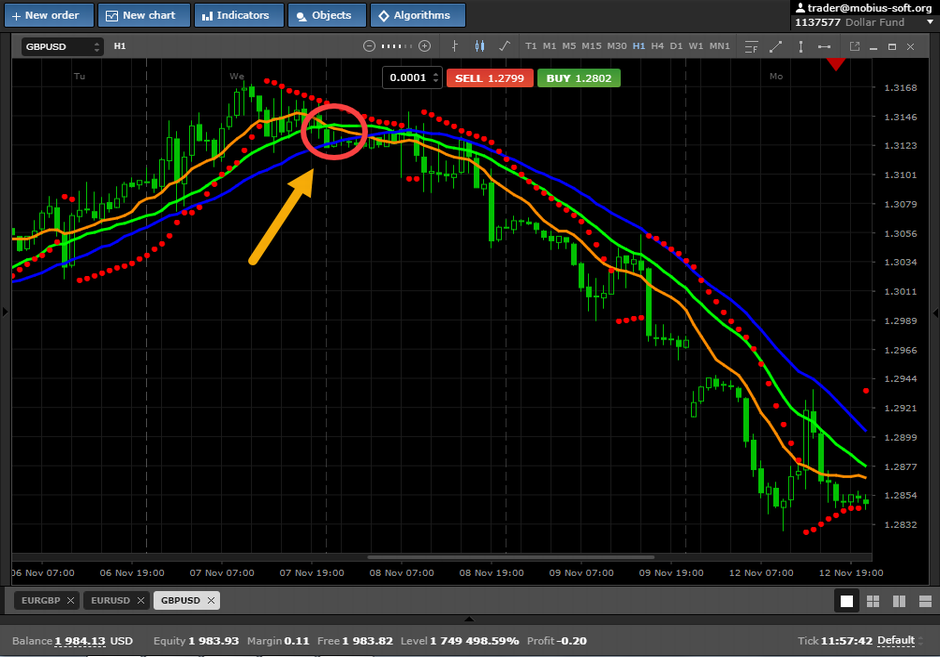
and at the same time the indicator Parabolic and the average with the greatest period are above.
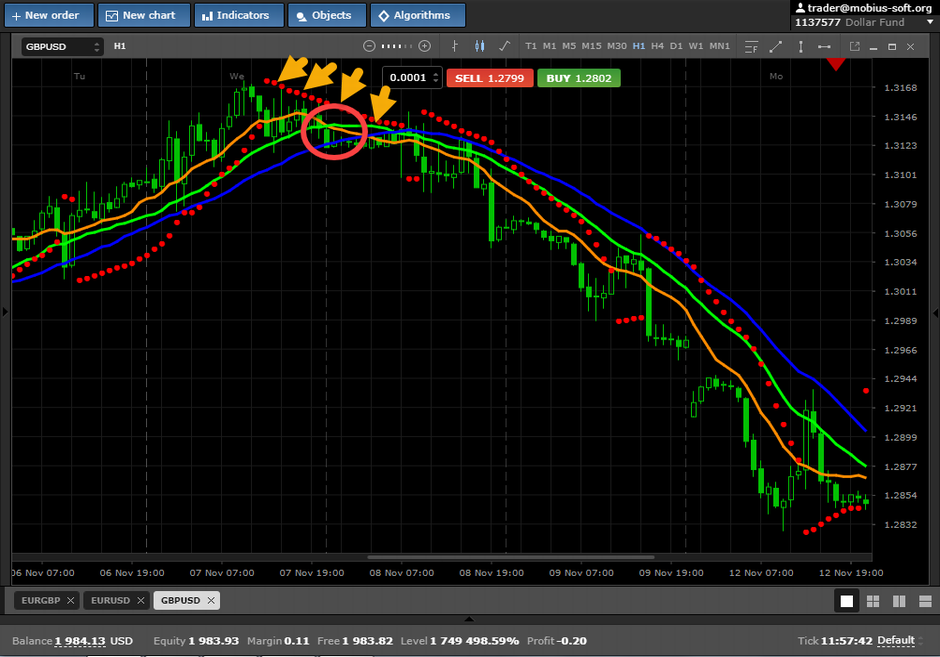
Stop loss we move together with the indicator Parabolic
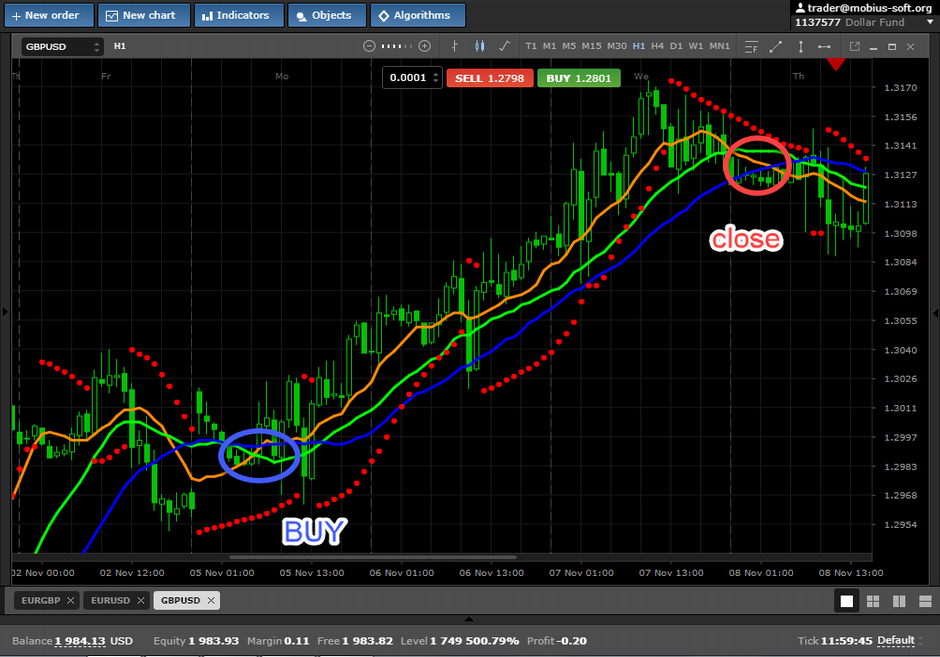
If transaction was not closed on stop loss, then we close it at the time of crossing of any two averages.
We wish you high profit.
It is possible to discuss this strategy

 Russian
  中文
中文  العربي
  Bahasa Indonesia