Russian
  中文
中文  العربي
  Bahasa Indonesia
 Trend is our friend. How to recognize the stages of a trend
Both for a large investor opening long-term transactions and for a speculator who is trying to make money on price changes in the short term, the movement of quotes is an indispensable condition for generating profit. Today we’ll talk about how a trend arises and develops, what processes occur at that time in the market for a traded asset. This information will help you learn to recognize the signs of a trend originating and ending, which, in turn, will allow you to more accurately determine the direction of the transaction and the entry point.
What is a trend?
A trend is a directional movement of quotes, and can be either upward (bullish) or downward (bearish). Speaking about a trend, they usually mean directional movement up or down, however, the trend can be lateral, for a certain time the price can be kept within the range.
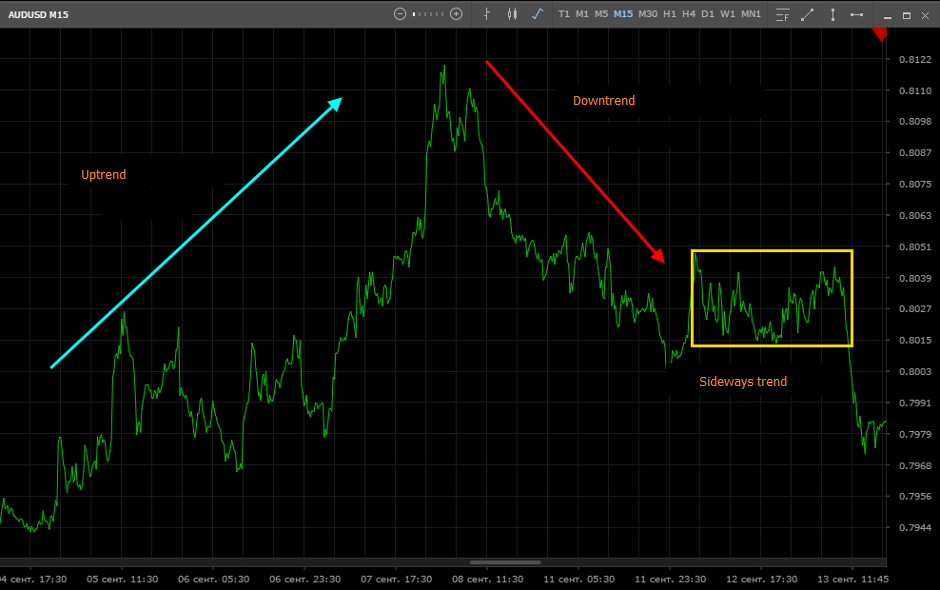
How to determine that the observed movement is really a trend? Trend movement can be considered as such only in relation to the timeframe the time period reflected on the chart. For example, if the price moves up during the whole trading session, then for a trader who trades intraday, this is, without a doubt, a trend movement.
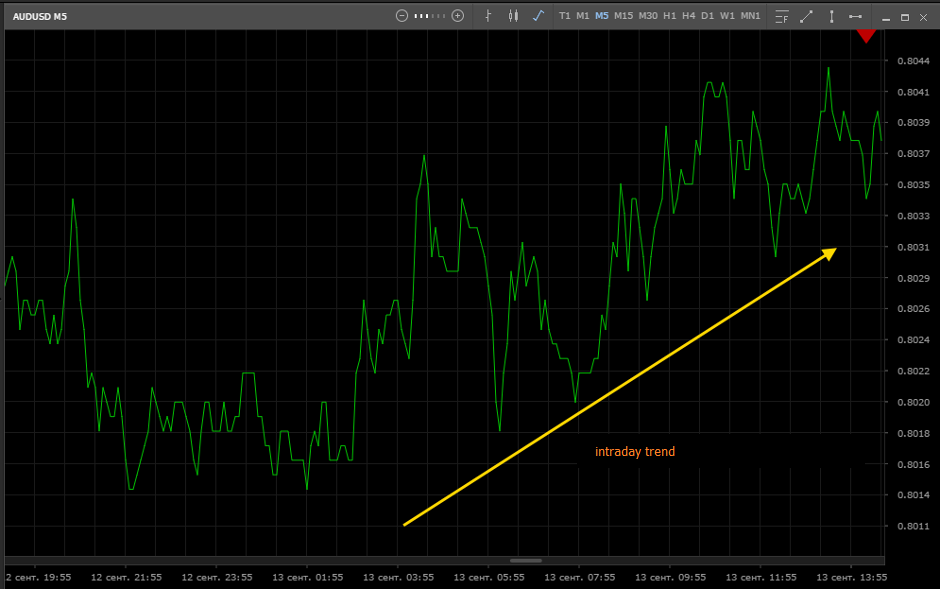
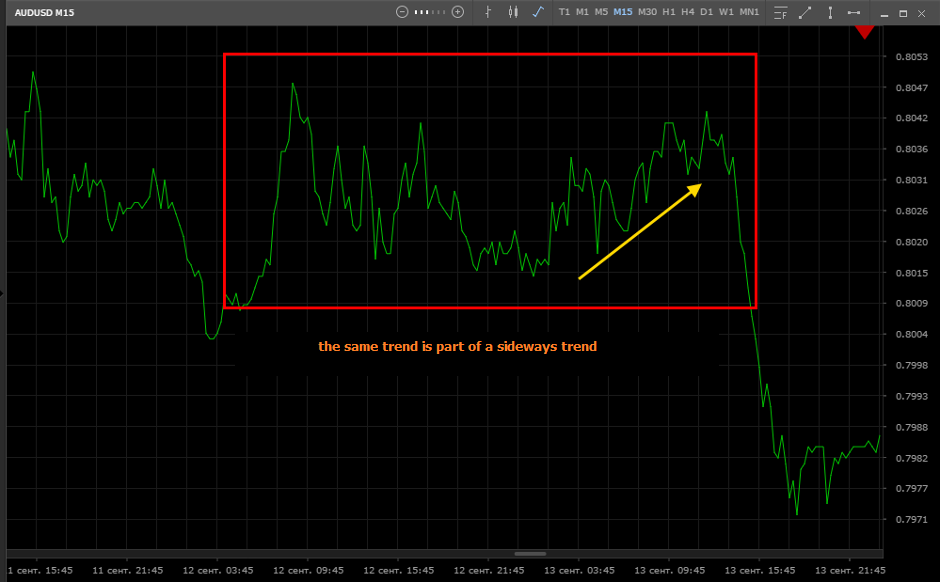
However, for investors who work in the medium or long term, this simple movement may turn out to be just part of a sideways trend. And vice versa, if inside the instrument quotes volatility is minimal and the price remains in a certain channel, then, for example, for a scalper who watches a minute timeframe and works with small price impulses, the movement from the lower boundary of the channel to the upper boundary can be considered as a good, clearly expressed trend . The following illustrations show the intraday trend, which is part of the sideways formed on the higher timeframe:
How and why do trends arise?
Why do trends come and go? In most cases, a long-term or medium-term trend is formed when there are certain fundamental prerequisites, in other words, the market wins back the players ’expectations. It is known that due to price changes a balance of supply and demand is achieved, however, who actually creates demand and forms supply?
The mechanism of functioning of financial markets is quite complex, so we will consider the process of trending with specific examples. However, you must understand that the actions of market players are not limited to the techniques described below.
Goals and objectives of market players
Large players (investment funds, banking institutions, holders of large capital), who are capable of deeply researching market factors in the long term and are highly likely to predict price changes, set the game and shape the market sentiment. It is they who shape the expectations of ordinary players - private traders trying to make money on a speculative game, as well as investors who purchase and sell the assets they need to do business (corporations that convert currencies for settlements or buy raw materials, place surplus capital in shares for dividends, etc.)
Considering a combination of market factors (economic indicators, political prerequisites), a major player concludes that, for a certain period of time, quotes of a traded asset will, for example, grow. If such a conclusion is made, it is necessary to invest money and purchase a certain number of lots of this asset, its derivatives (futures, options) or other instruments that correlate with this asset.
If this is a large investor, he needs to buy a large number of lots at the lowest price. However, at the price he needs, there is only a very limited number of bids for sale, so he simply will not be able to buy as much as he needs within the investment strategy. As he absorbs bids, the price will rise, which, in general, is contrary to the interests of the investor.
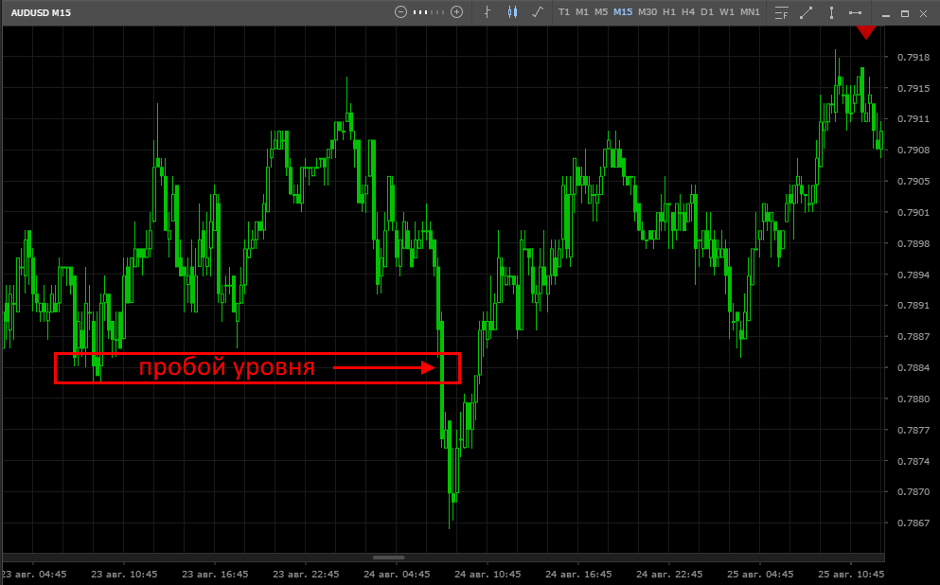
Realization of expectations. Buying at a bargain price
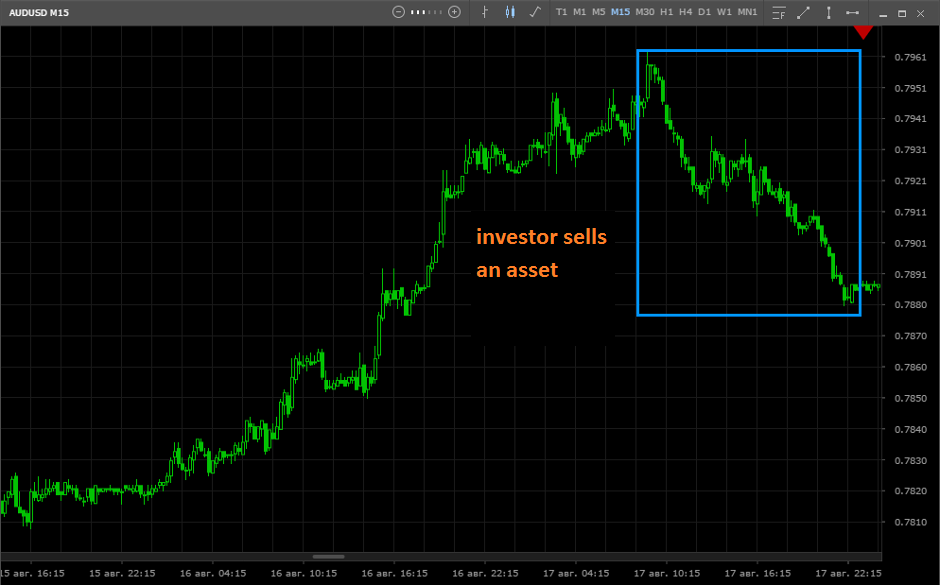
Now traders who see the breakdown of the level, also begin to sell, and those who have already bought, close part of the positions. If at this moment the market sees large bids for sale, the downward price movement will accelerate, so the investor also sells and the trend begins. Now that the price is confidently moving down, and most of the players are selling, the investor can only buy out applications for sale, that is, buy an instrument at a price that is favorable to him. By the time all interested persons have time to sell, the investor will already pick up the required number of lots and will wait for the price to rise. The figure below shows the period of active sales:
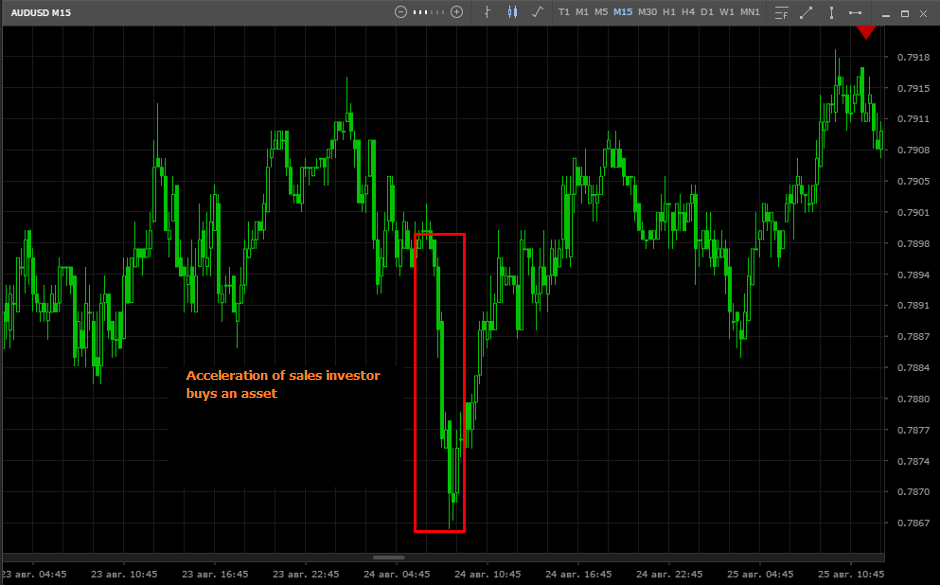
By inertia, the price may go down for some time - these are traders who see a downtrend and are trying to manage to make a profit before it ends. In addition, a large investor can check to see if there really are no more willing to sell. To do this, he collects a few bids for sale, sending the price lower, and if there are no more sellers, he collects bids for the purchase, a candle with a long tail appears on the chart.
Probing the bottom
Some traders who entered the market on time and sold for breakdown close their positions and take profits. Those who closed purchase orders at the beginning of the trend suffered moderate losses. Players who held their positions to the last, and only then closed their positions, suffered serious losses. In turn, the investor, who has been buying up the applications of the first, second and third all this time, is completely ready for the growth of quotations. Now it is necessary to provoke an upward movement, which will allow:
First, reach the original price. By the time the initial price is reached, not only the losses associated with the need to collect sales orders “upstairs” will be repelled, but also significant profit will be generated;
Secondly, make a profit when the price reaches the price level planned before the downtrend.
The set of positions below. Investors collect bids for sale
However, the fundamental (and other) factors that guided the investor before initiating a downtrend are also observed by other major players, they also understand that the price may soon begin to rise. Because of this, major players refrained from selling all this time and expected the termination of the downtrend. Actually, all the movement was provided by small speculators (market mass), whose actions were fully consistent with the interests of the investor, and some of them made a profit, and some suffered losses.
When the trend movement has moved sideways, for large players, it is time to act. They, as an investor in the example described above, are interested in buying at the lowest price, and this can only be done if the maneuver is invisible to most traders. Therefore, purchases are made in small lots, and are carried out approximately in the middle of the channel being traded:
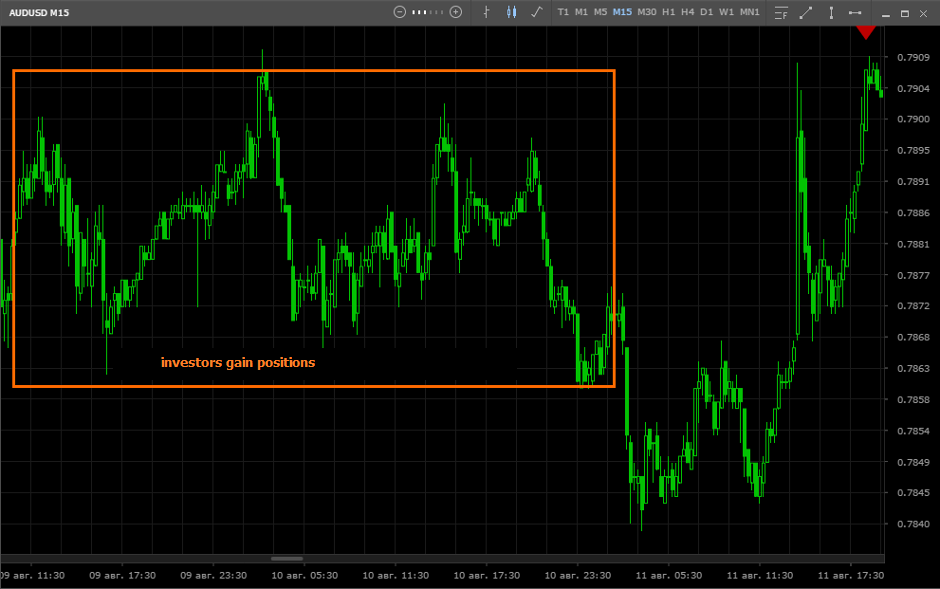
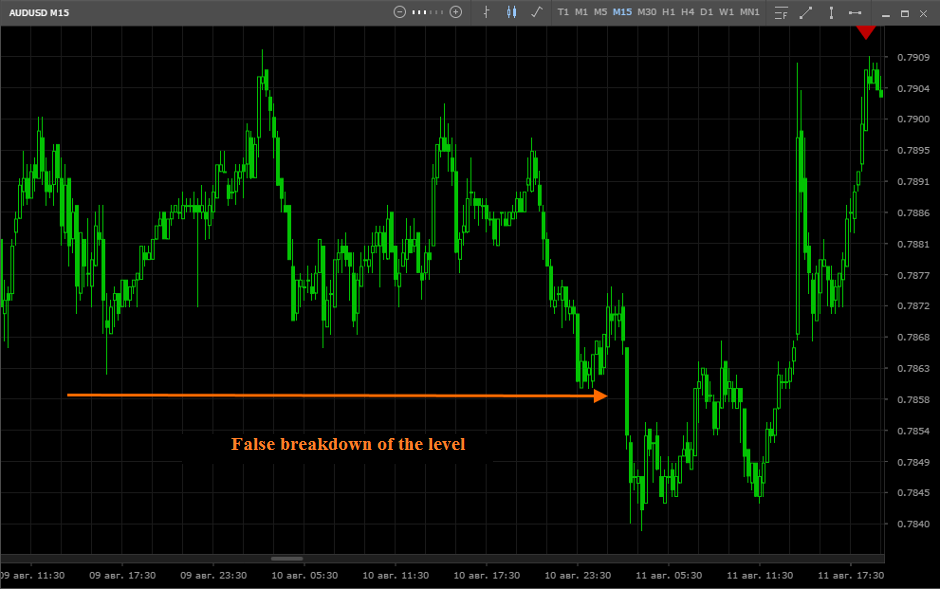
From time to time, large players try to provoke downward movements (as described above or using other techniques). If they find that there is potential, then a breakdown of the level follows and the price rises even lower. If there are few people who want to buy, the breakdown turns out to be false, and from that moment the price begins to rise, prompted by the purchases of large investors, to which the market mass is vividly responding. During a false breakdown, there are many who want to sell, their applications are absorbed by large players:
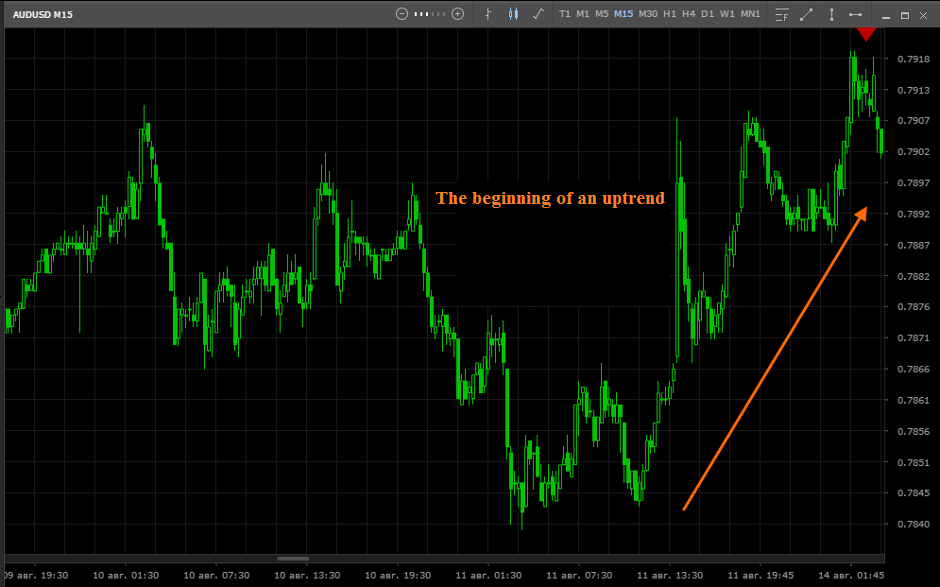
The beginning of an uptrend
At this point, many traders hope that the price will fall, and there will be another attempt at breakdown below, so traders do not buy, but continue to sell. There are few applications at each price level, and they are quickly absorbed, so the price quickly overcomes level by level. As a result, the price can continue the directed movement for several days, spurred by the market mass, until it reaches the level that large players expected.
Distribution. Profit taking
Upon reaching this level, they must close orders in order to take profits, and this also needs to be done unnoticed by traders. There is a lateral movement, where buy orders are gradually bought up by those who are waiting for the continuation of the trend:
Trend Phases on a Chart
Understanding the described technologies allows us to draw the following conclusion: the trend has three stages: nucleation (accumulation), active development and attenuation (distribution). These stages include trends that form on any timeframe.
During its inception, the investor accumulates positions, forcing traders to expect a trend in the opposite direction and accept his applications;
Active development is accompanied by rapid price increases, at which the investor collects a few bids for sale;
During the decay, positions are distributed, the investor sells the accumulated positions to traders, who this time expect a continuation of the trend, and fixes the profit.
At each of the phases of the trend, there are many false breakdowns, the price can return or linger in a certain price range, which makes forecasting much more difficult. So, in a side view, a distribution can occur, after which both correction and an additional set of positions are possible, after which the trend continues.
After the trend damps, the price moves in a narrow range (flat occurs), or the next movement starts immediately if fundamental prerequisites have already formed for it. The market expects a new situation to develop or continues to win back expectations. Investors, in turn, evaluate the totality of factors and take appropriate actions, forming the appropriate expectations of the market mass.
Trend phase recognition
Now we will list some signs that allow you to recognize an emerging trend, its continuation and end. Depending on the timeframe, the selected asset and the trading strategy, the trader independently develops and tests patterns (models on the chart), so some of the signs we cited may not correspond to the nature of the price movements of a particular instrument. In the examples, we will consider an uptrend, to determine a downtrend, the signs remain the same, only the direction changes.
Signs of the emergence of an uptrend
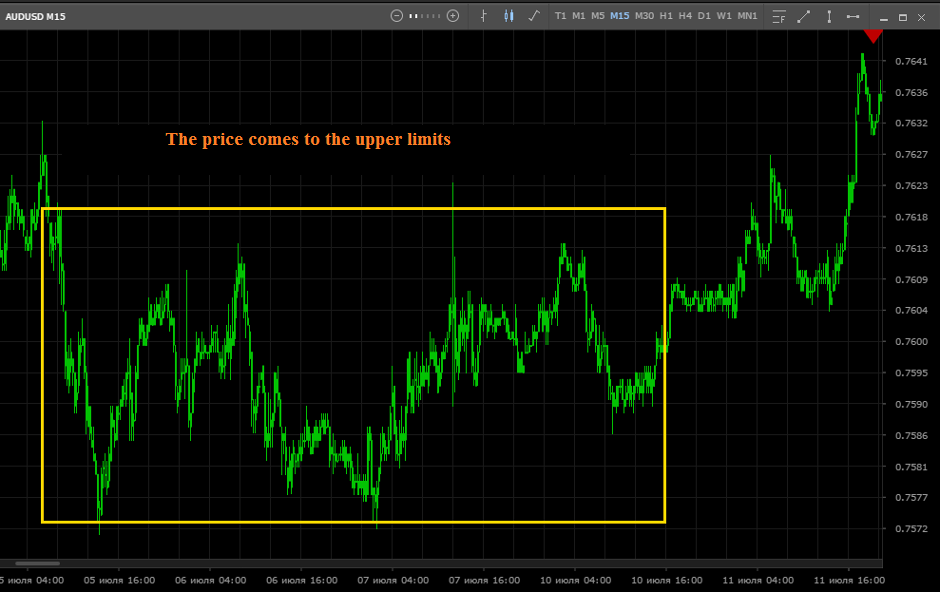
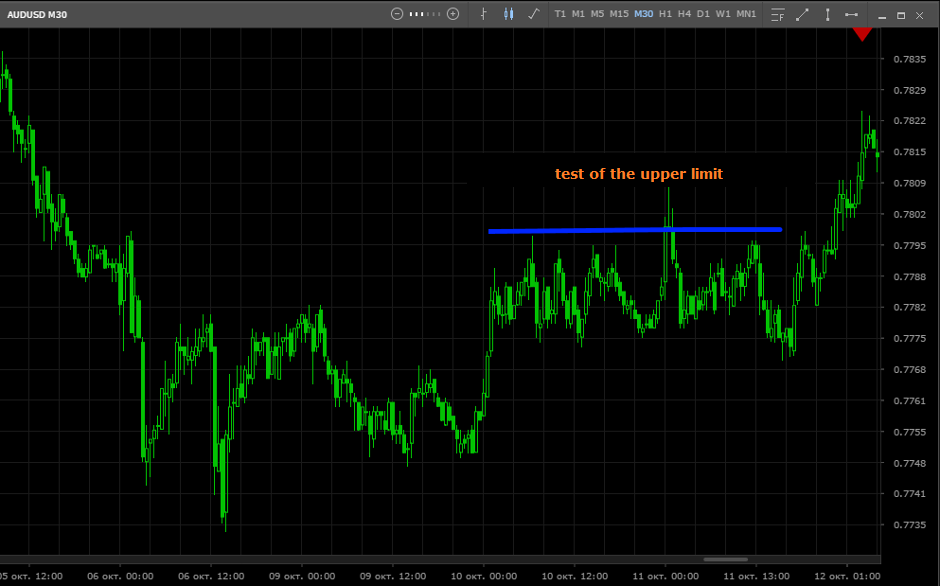
During a sideways trend, the price periodically tests the upper borders of the channel and slowly returns to the range:
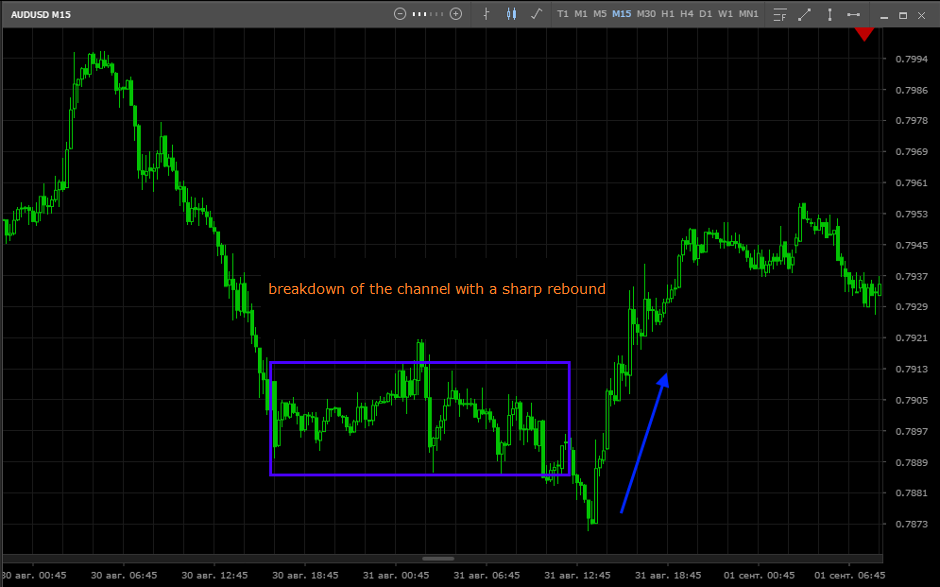
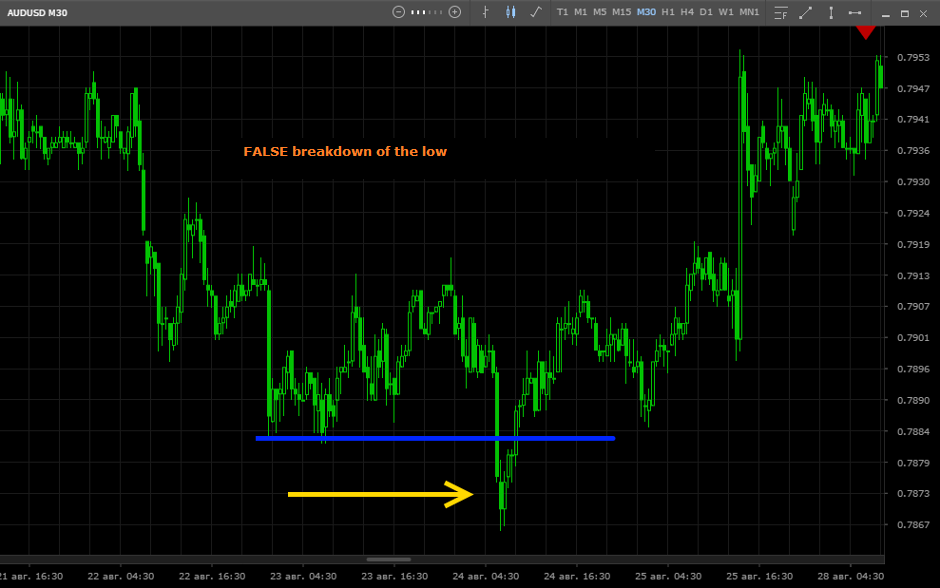
- A false breakdown of the range down with a sharp rebound may indicate the imminent start of an uptrend:
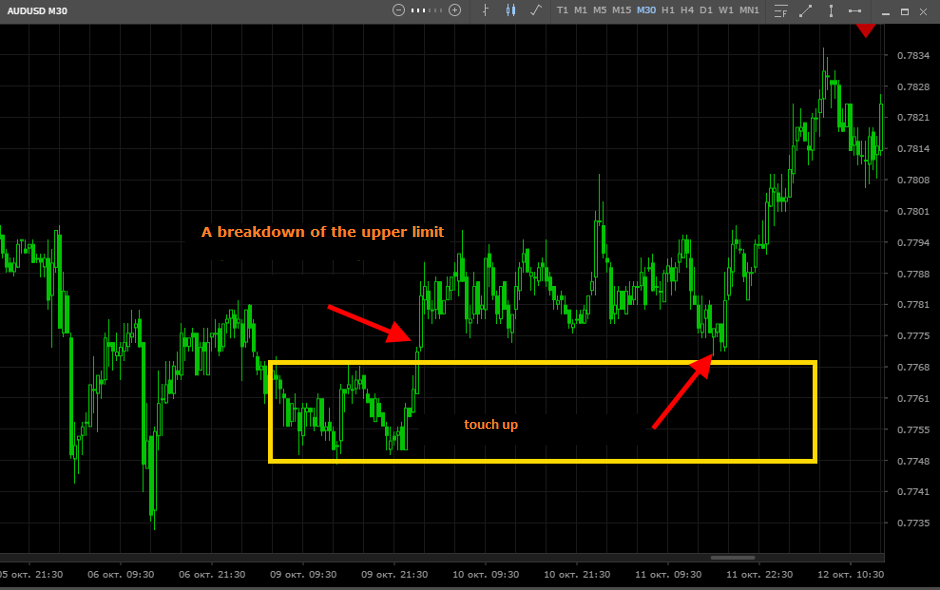
- A breakdown of the upper limit, after which the price returns and tests the range limit from above, but does not return to the channel (or returns for a short time, but rushes up again) may indicate the beginning of a trend:
Signs of development and continuation of the trend
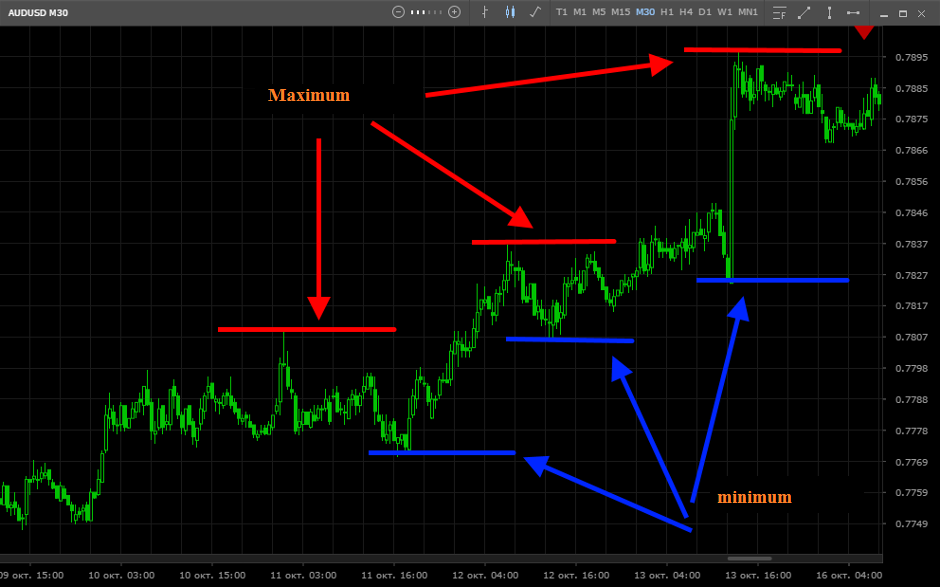
- The main sign of a trend movement is the achievement by the price of new highs, and during bounces, the new minimum should be higher than the previous minimum:
- The price after correction reaches the last maximum and is held in the formed price corridor, after which it tests the upper limit:
- The price returns to the last local minimum and its false breakdown follows, which is accompanied by a sharp bounce up:
Signs of the end of the trend
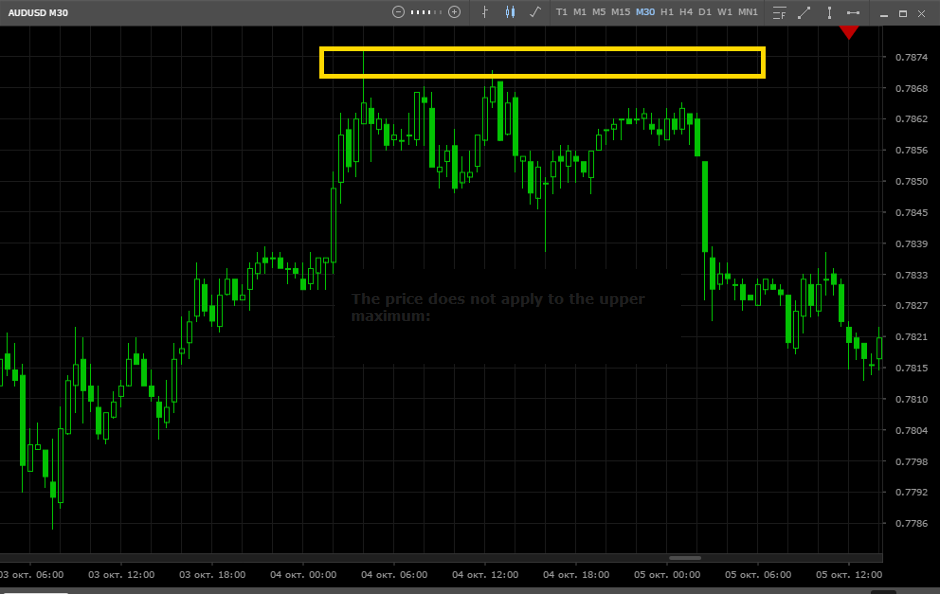
- The price forms a side corridor and does not apply to the last maximum:
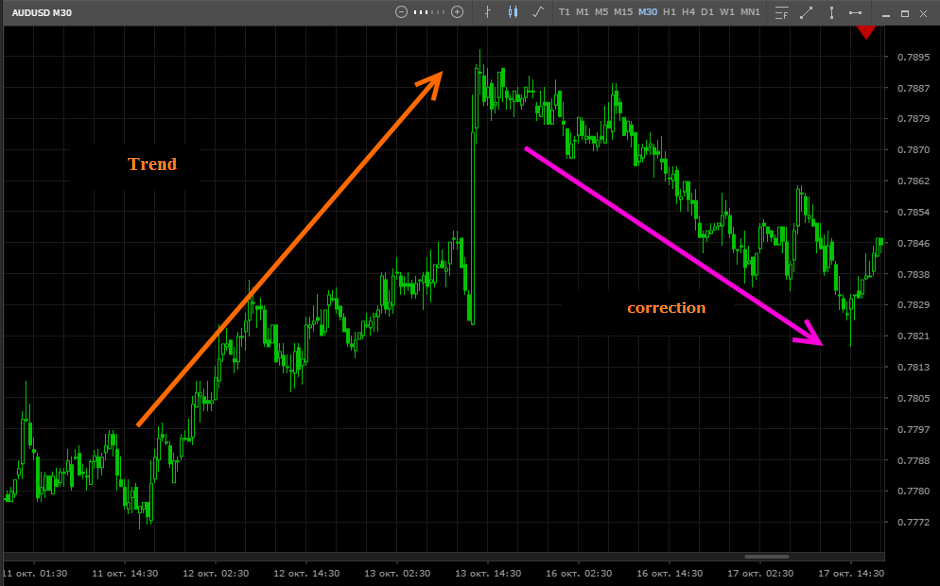
- After the peak price, a deep correction follows:
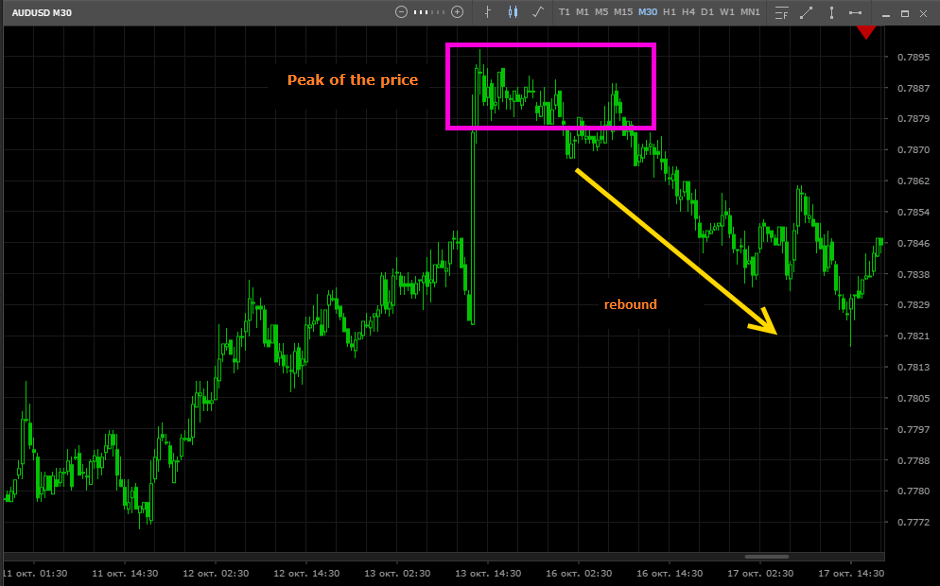
- After reaching the peak of the price there should be a sharp bounce down:
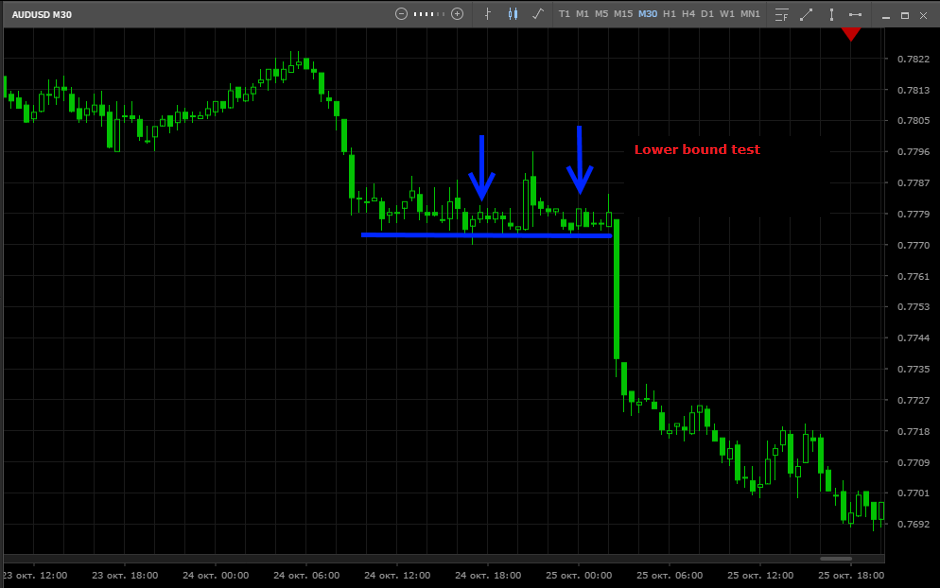
- The price moves in the side channel and periodically tests the lower border, while there are no sharp rebounds: