
 Russian
  中文
中文  العربي
  Bahasa Indonesia
 Buy at the bottom and sell at the top. Features of trading in the range
The topic of the article is very relevant for many traders. As is known from statistics, 70% of the time the market is in fairly narrow and almost horizontal ranges (flat) and only 30% in trend movements that connect the flats to each other. Everyone knows how to trade in trends - “the trend is my friend”, this is the golden rule of the trader. But how to trade flat? Many leave there all the profit earned according to the trend, not realizing that this is not a reversal, and the trend has only temporarily suspended its movement and the market is gathering strength before its new stage. In this article, we will analyze the basic principle of flat trading. Not everyone is able to sit near the monitor 70% of the time waiting for a trend and not trying to trade. Are they trading intraday?
What you need to know to trade in the range?
To begin with, we determine the time interval - the flat on the minute chart can last from several minutes to tens of minutes and will be just a connecting section for the trend in the scale of the hourly chart. That is, the eternal question - who are you (intraday or medium term) is relevant here.
The answer to this question will give the answer to the following - it will determine the level of risk per transaction. Inside the day, the lot will be larger, the stop is shorter, the take is closer, the transaction flow time is shorter.
Well, the main question is where to enter and where to exit the transaction? There is also an answer to it - buy at the bottom and sell at the top (buy cheap - sell expensive). The only small problem is where is the bottom and where is the top and is it really cheap already? Or maybe still expensive?
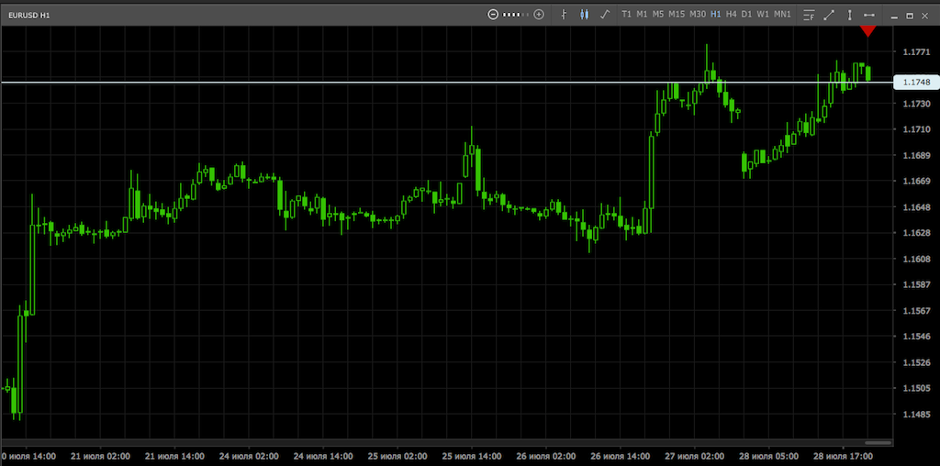
The answer to the latter and for many - the main question will be given by a system of technical analysis. What is the best way to rely on when trading in a range? The most reliable criteria are support and resistance levels. They have no alternative when trading in flat. The resistance level is already expensive and the support is still cheap. This can be taken as a basis when building an analysis system to determine the levels of opening and closing deals. Consider the above recommendation as an example. The base is the time interval H1, the EURusd instrument, the most liquid and traded by most traders.
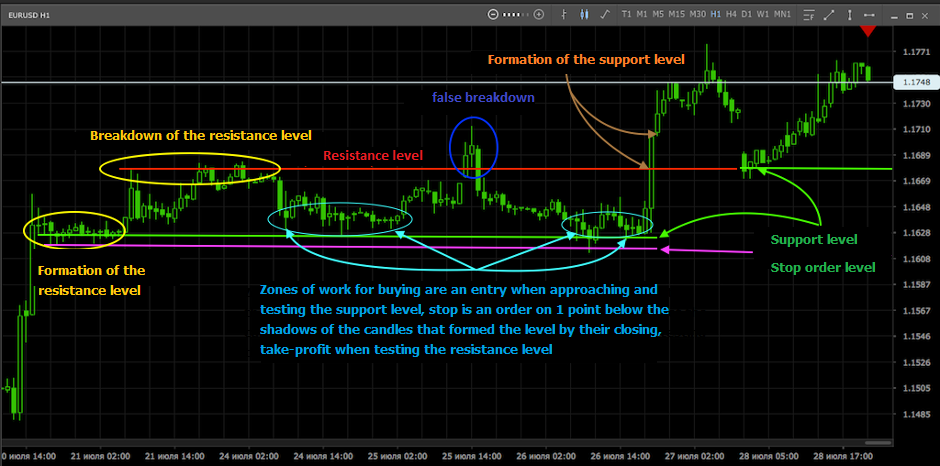
We read the chart from left to right. After the upward impulse, support and resistance zones are formed, indicated in the figure by yellow ellipses with accompanying text. At the end of their formation, we can identify the levels (support is indicated in green, resistance in red, level for placing a stop order, in purple). It is recommended to take the closing prices of candles as the base of the level, and the prices by shadows (extremes) abroad of the level. This allows you to more correctly determine the current operating range and avoid losses on stop orders, without which it is simply impossible to trade flat. It is also recommended to trade only in the direction of the previous trend. In our example, only purchases are traded. The figure also illustrates a false breakdown of the resistance level (blue oval with accompanying text) and shows the actual breakdown of the level with its reverse testing (brown arrows with accompanying text), after which the resistance becomes support and is then traded similarly to the described technique.
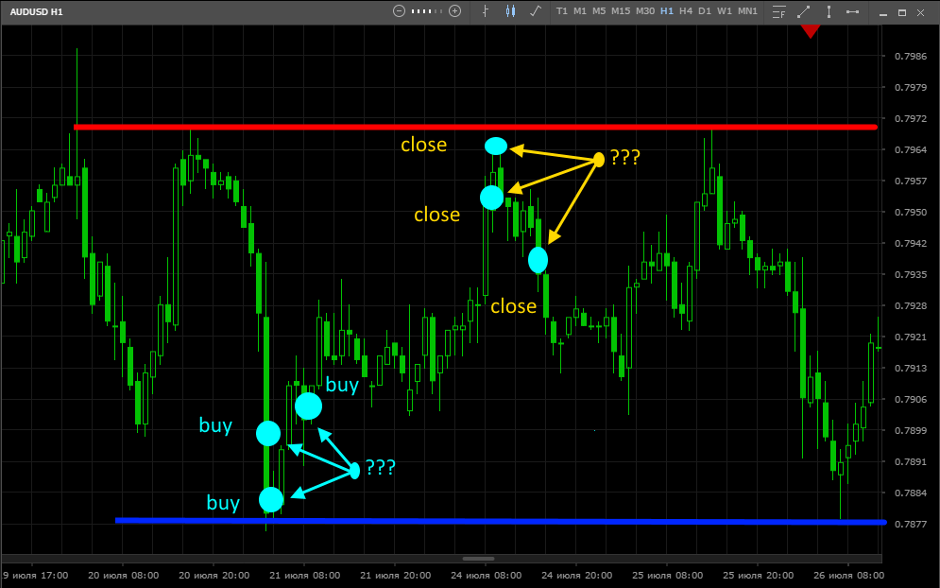
Trading from resistance is also possible, technically entering sales in this case is similar to buying, but it is recommended to refrain from counter-trend transactions because the risks of receiving a stop order in this case are much higher than with transactions in the direction of the previous trend.