
 Russian
  中文
中文  العربي
  Bahasa Indonesia
 Fibonacci levels
Fibonacci levels are a popular graphic element widely used by traders when conducting technical analysis. It was based on the digital sequence of the famous Italian mathematician Leonardo of Pisa. He discovered an interesting numerical pattern, which manifests itself in almost everything, including natural phenomena.
The Fibonacci series is arranged in such a way that the following digits are the sum of the two previous values (1, 1, 2, 3, 5, 8, 13, etc.). Moreover, if we divide one value by the next one, we get approximately one result - about 0.61. If you skip one value, the result of a similar arithmetic operation will always be 0.38. Such patterns can be traced in a number series and further to infinity.
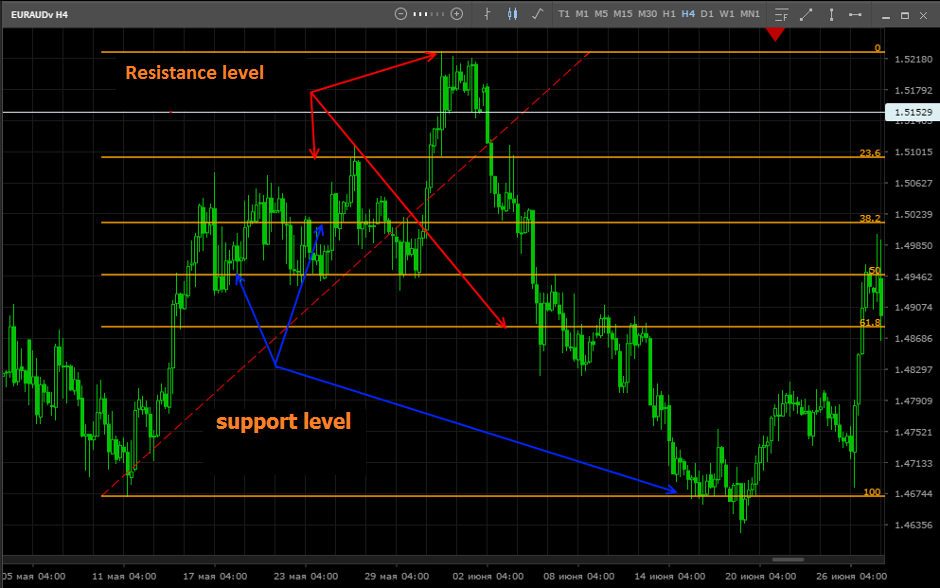
The calculation of Fibonacci levels on Forex is carried out just taking these figures into account. It is not difficult to notice that the value of the lines is 23.6, 38.2, 50, 61.8, 100, etc. The relationship of the indicated levels with the values of the candlestick chart is also clearly traced. In fact, support and resistance levels were built.
Fibonacci Overlay
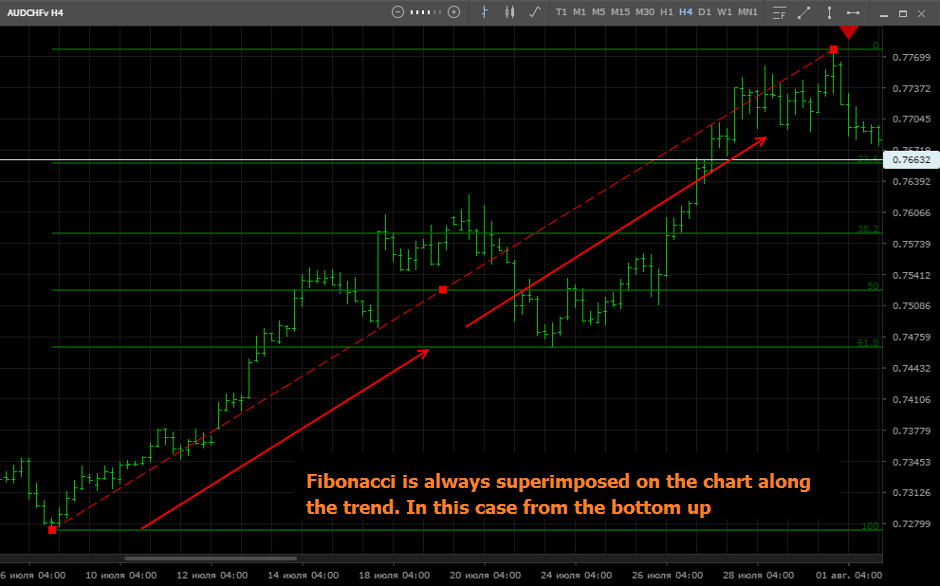
To correctly assess the situation on the market, Fibonacci levels should be correctly applied to the chart. First you need to find the minimum and maximum prices (extremes). Then, in the “Elements” terminal menu, select the appropriate tool and draw it on the chart so that the red line is rubbed from one point to another. Fibonacci levels are always superimposed in the direction of the trend.
A good example of Fibonacci trading
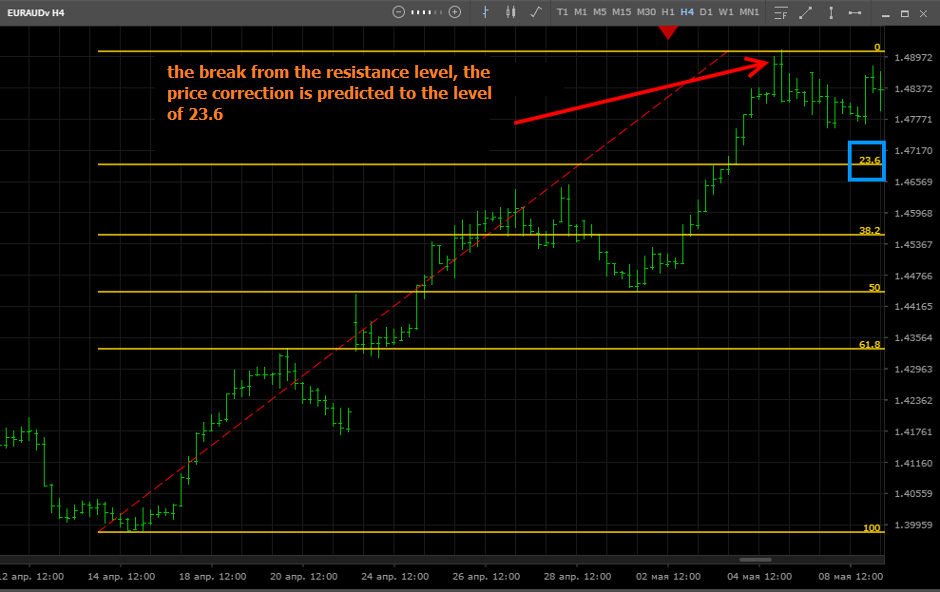
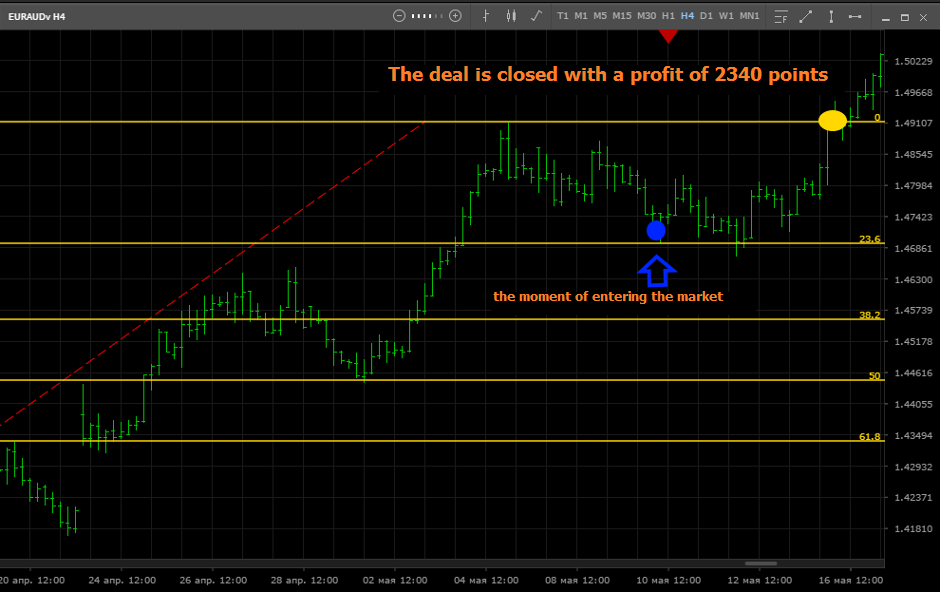
Fibonacci levels allow you to define invisible levels of support and resistance. In the above example, after overlapping the lines, the support level (23.6) and resistance (0) are visible. With a high degree of probability, the price will reach support, after which it will turn around and go up at least to a line with a value of 0. The optimal entry point to the market is the moment of touching the level of 23.6.
After some time, the price reaches the support level. This is the best entry point to the market. The deal is opened in such a way that the stop-loss was on the 38.2 line (the next support level), and the take-profit was on the resistance line with a zero value.
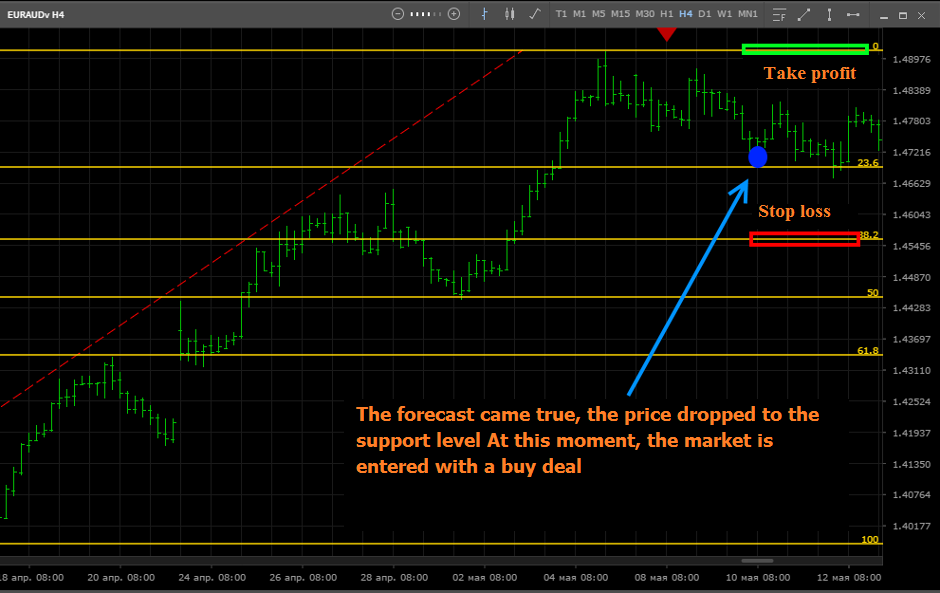
The forecast came true, the price reached the indicated point. The deal lasted 4 days, and profit amounted to 2340 points.
After breaking through the resistance level, you can close the deal or partially take profits in the hope of further price increases.