
 Russian
  中文
中文  العربي
  Bahasa Indonesia
 Fractal analysis
Fractal analysis is strategies for analyzing foreign exchange and stock markets, which is successfully used by Forex traders. The main postulate of this theory is the conclusion that past values influence future price indicators. It follows that, as a result of a careful study of archive quotes, it allows us to make forecasts regarding pricing in the near future. A large number of Forex trading strategies have been developed, which are based on a fractal analysis.
The theory itself denies the use of linear models, on the assumption that the market is a multi-level self-regulatory system. For fractal trading, the use of technical analysis indicators is not mandatory, but auxiliary tools can be used to facilitate the recognition of characteristic formations on the currency chart.
What is a fractal?
A fractal is a characteristic figure drawn on the chart in the form of Japanese candles. The final fractal formation requires the presence of 5 bars, while the same group of candles can be taken into account. Characteristic candlestick patterns were found as a result of computer analysis of a large amount of historical data on asset rates. There are two types of fractals : down and up.
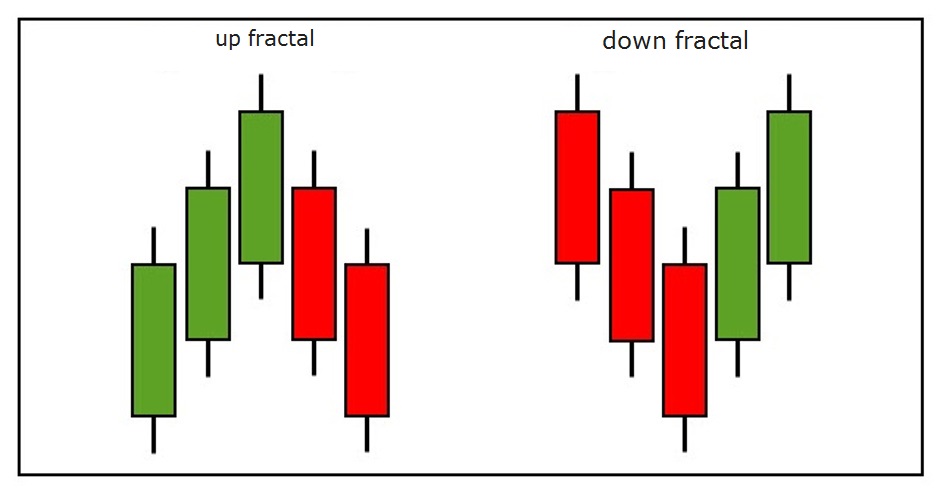
In each direction there is a large number of variations of various candlestick figures. But there is one general rule for the formation of fractals: the middle candle should be more or less than the rest of the elements surrounding it.
Fractal analysis in practice
The Mobius Trader trading terminal has the Fractals indicator developed by Bill Williams. It automatically determines the bottom or top of the current price movements. There are many techniques in which fractal analysis is applied. For example, a strategy using the Stochastic indicator is very popular, which allows you to recognize periods of short-term correction and not trade against the trend. However, for starters, you should consider the classic approach, which does not require any additional indicators. If desired, fractals are easily detected manually without auxiliary tools.
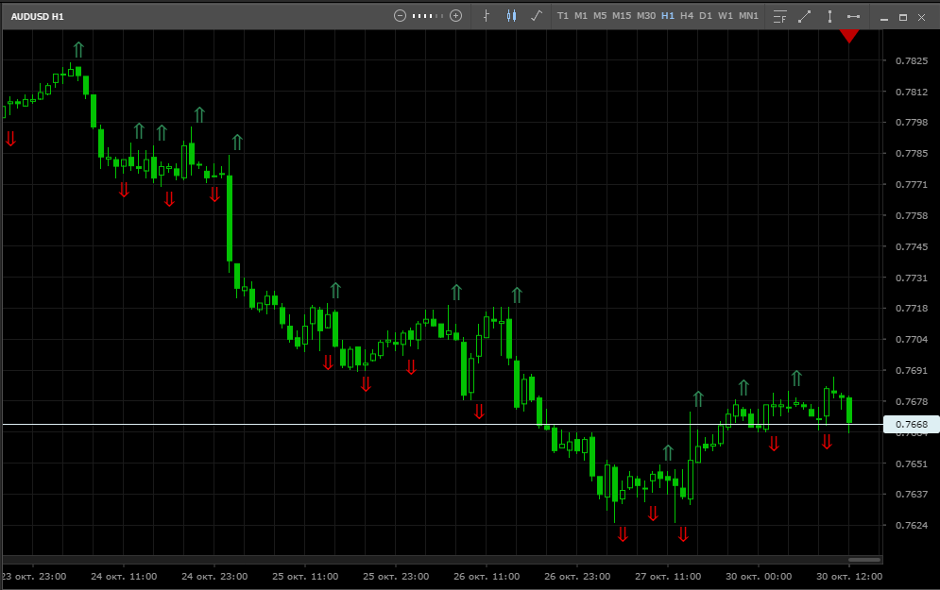
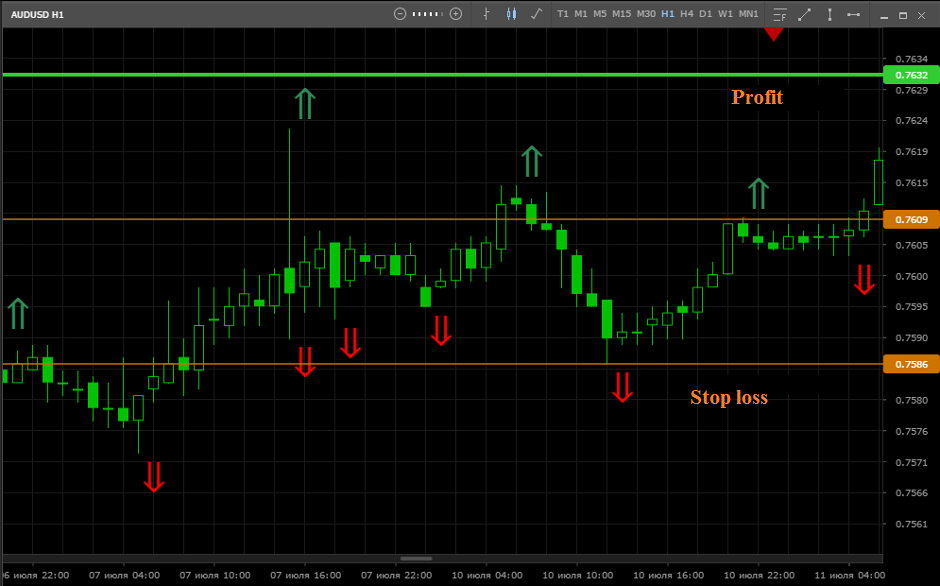
The most popular strategy is to trade on the breakdown of fractal levels. To do this, you need to find two opposite arrows on the chart and draw lines according to their level.
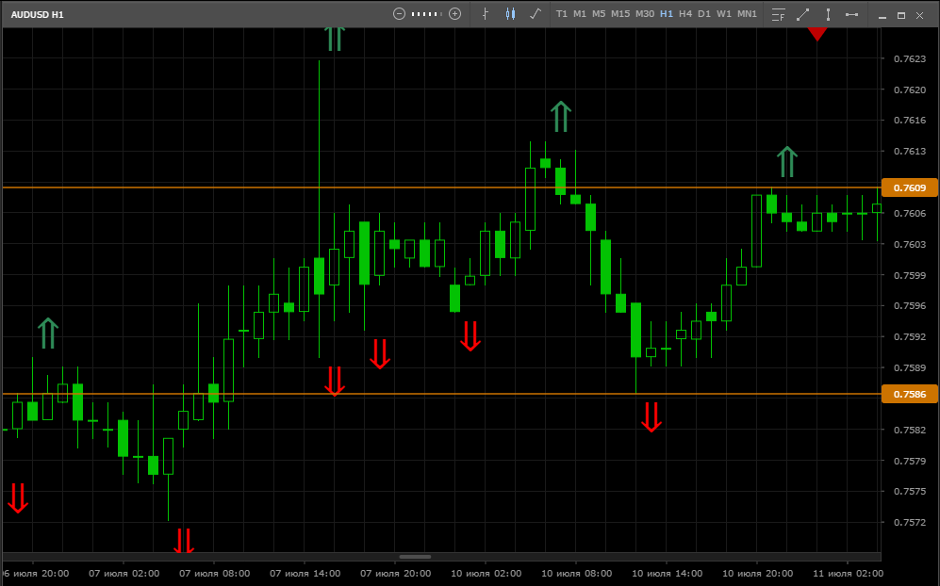
In this situation, you should wait until the price overcomes the level of one of the fractals either the upper or the lower. The terminal specifically for such cases provides for the placing of pending orders. In this case, you need to create two transactions Buy at 0.7610 and Sell upon reaching the rate of 0.7585. Stop loss of a buy transaction is equal to the last lower fractal, and for a sell order, at the top. In case of breaking through one of their levels, a price movement is forecasted to be at least 23 points (channel width). Take profit should be set based on this value.
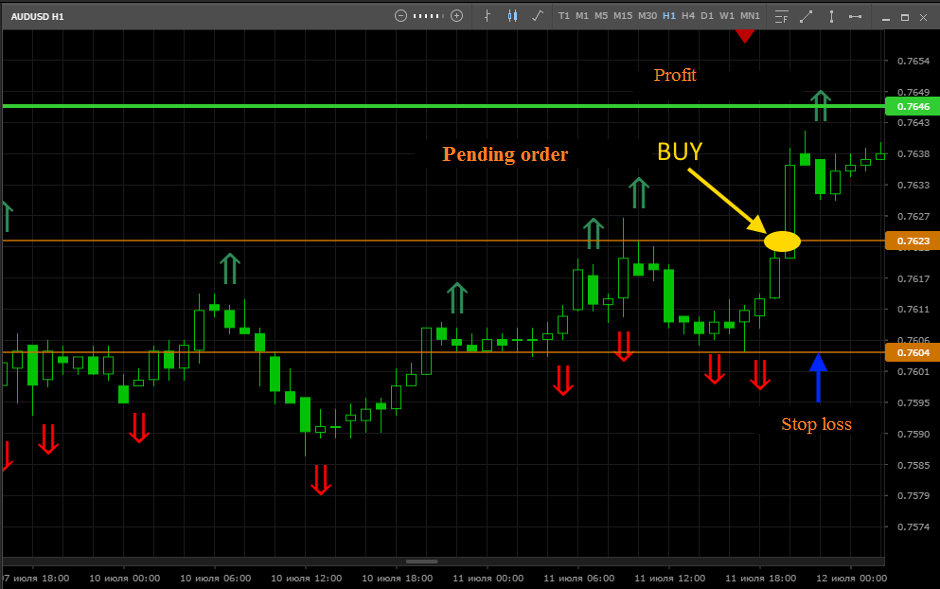
So, the price has overcome the level of the upward fractal. If a pending buy order was placed, it will automatically work. Take profit is 23 points higher. Stop loss is equal to the bottom line on the chart (0.7586).
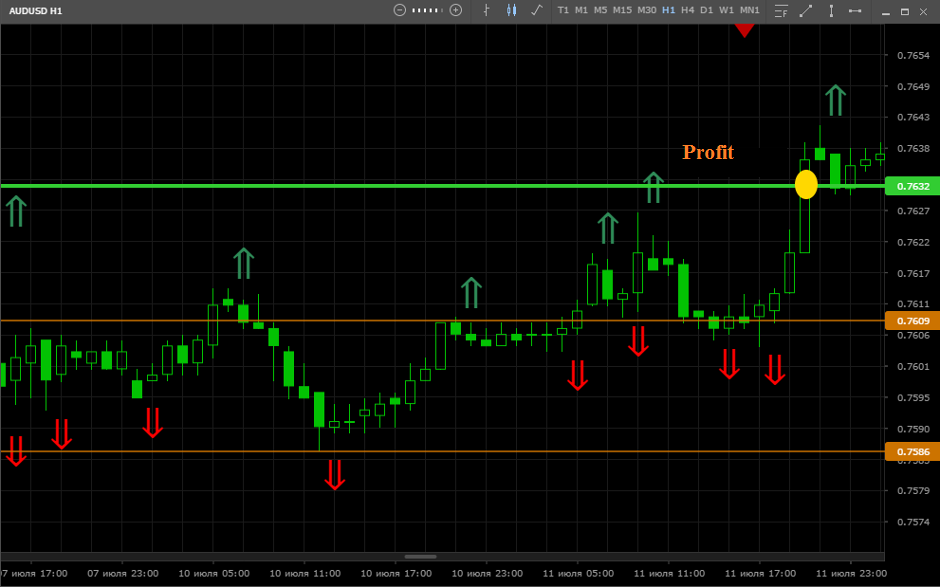
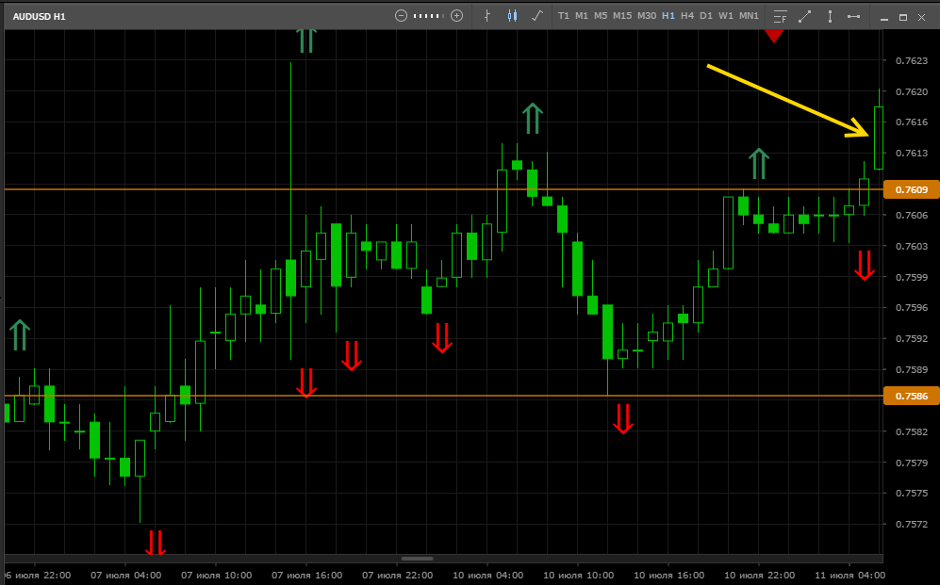
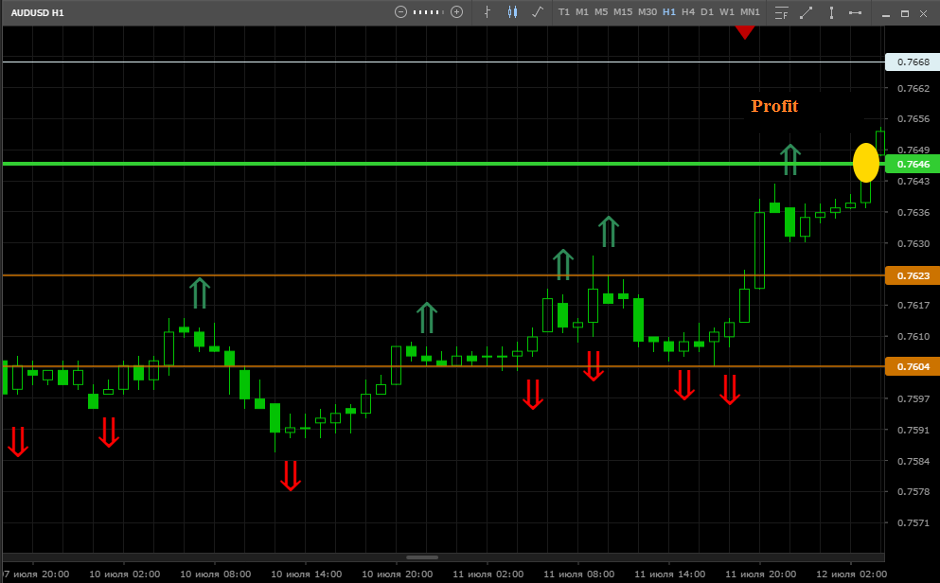
As you can see in the picture below, the price successfully overcomes the take-profit level the deal closes with a profit of 23 points. In such situations, some traders prefer not to close the deal, but to set a trailing stop. With a successful combination of circumstances, when the trend turns out to be long and strong, with this approach you can get significant profit in just one operation.
Still at the approach of the price to the marked level, it would be appropriate to place a new pending order. In the picture below, the yellow circle marks the moment the second purchase transaction was opened.
After some time, the deal also closes with a profit of 23 points, which, as you know, is equal to the width of the fractal channel.
Provided that a suitable situation is formed when two opposite fractals form a successful combination, you can re-enter the market. On pronounced trends, this strategy allows you to make big profits.
It should be noted that such a predictable price behavior, as in the example considered above, is due to several factors. Firstly, single fractals do not give such accurate signals. In this situation, we were dealing with the accumulation of several fractals at an approximately equal level. Secondly, fractal analysis implies trend trading. Therefore, to improve the accuracy of signals, it is recommended to analyze several timeframes. For example, if the main period is M30, then the signals should be adjusted on the graphs H1 and H4.
findings
Fractal analysis allows you to trade on a "clean" chart. However, its full potential is revealed only in combination with other effective methods of technical market analysis. The Mobius Trade terminal has 5 additional indicators from Bill Williams. Nevertheless, each trader must understand the basic principles of manual fractal analysis.