
 Russian
  中文
中文  العربي
  Bahasa Indonesia
 Graphic elements
Forex graphical analysis is still the main one. Indicators and additional tools act as auxiliary solutions. Graphical elements are applied to the graph manually - these are lines, channels, shapes and other objects. They allow the trader to conduct analytical work and make forecasts regarding price movements in the future.
When looking at a chart with a sufficient number of candles, the trader immediately sees the direction of the trend, support / resistance levels, characteristic reversal patterns, etc. For example, if the price several times approached approximately the same level and turned in the opposite direction not far from it, this is a sign of a support or resistance level. If the price moves in zigzag movements from one fixed level to another, then this is a sign of the presence of a channel. And so on. Graphical elements are added to the graph only to simplify the visual analysis and underline the figures traced on it.
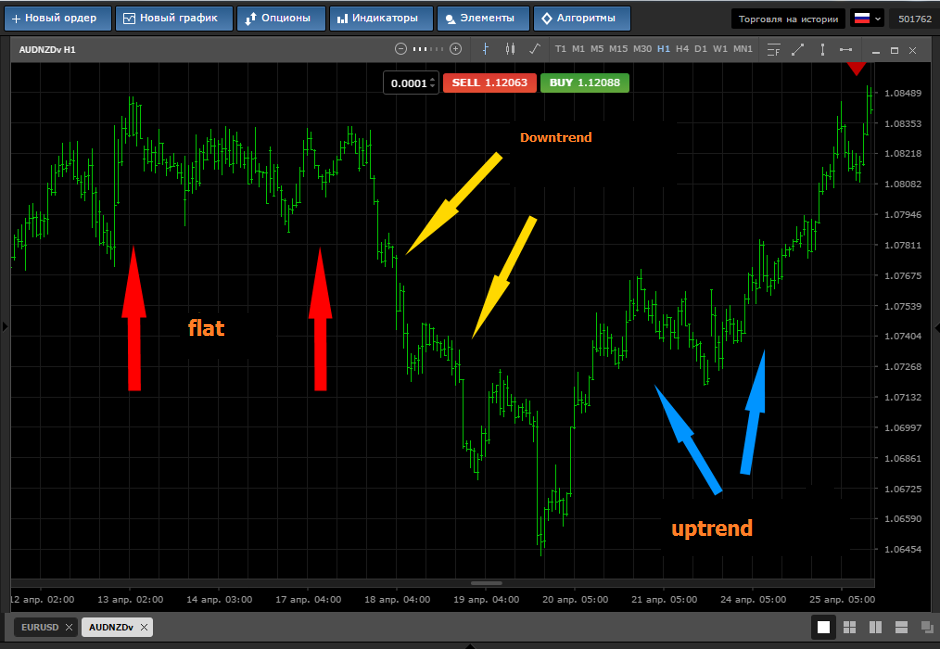
Consider a good example. Before us is a clean chart, it would be much easier to predict the price movement on it if you put graphic elements on it.
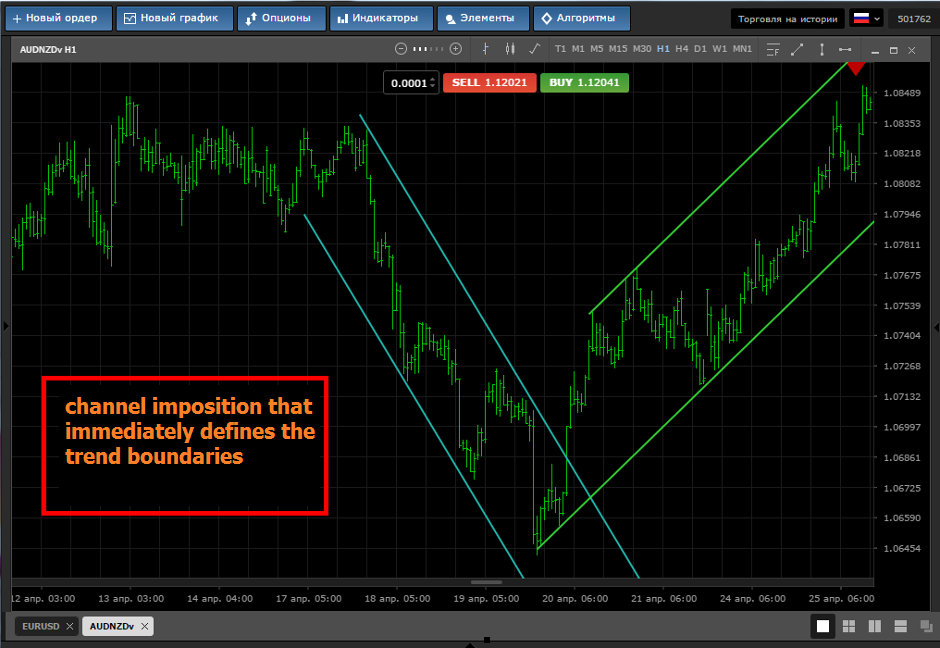
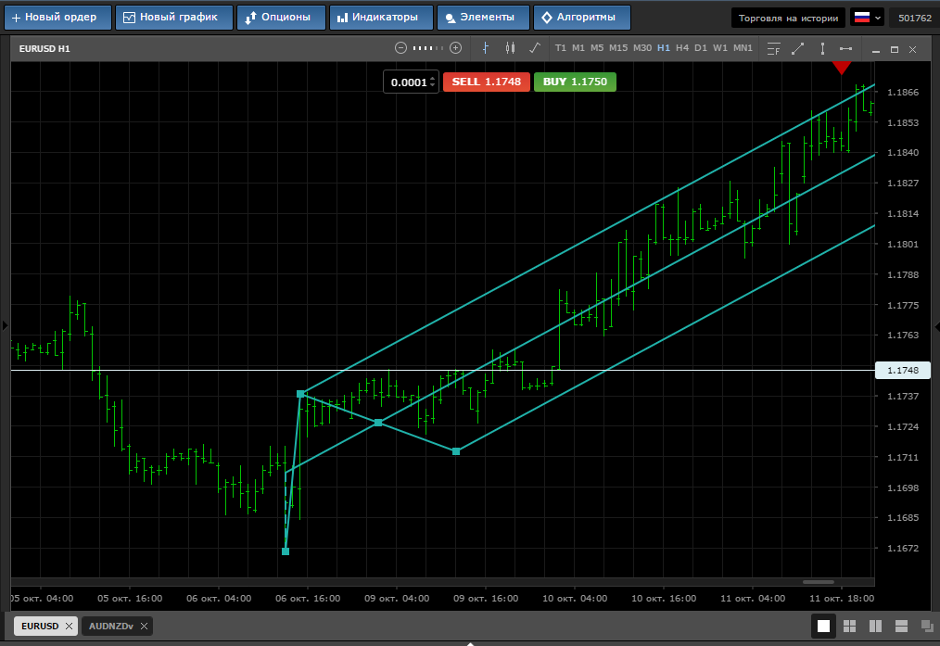
What does the same chart look like after applying graphic elements that emphasize the traced patterns of technical analysis:
Adding Graphic Elements
The Mobius Trader terminal has an expanded set of various elements that can be added to the currency chart. The most popular ones are placed on the main toolbar - this is a trend, vertical and horizontal line, as well as Fibonacci levels. The rest can be found in the "Elements" menu.
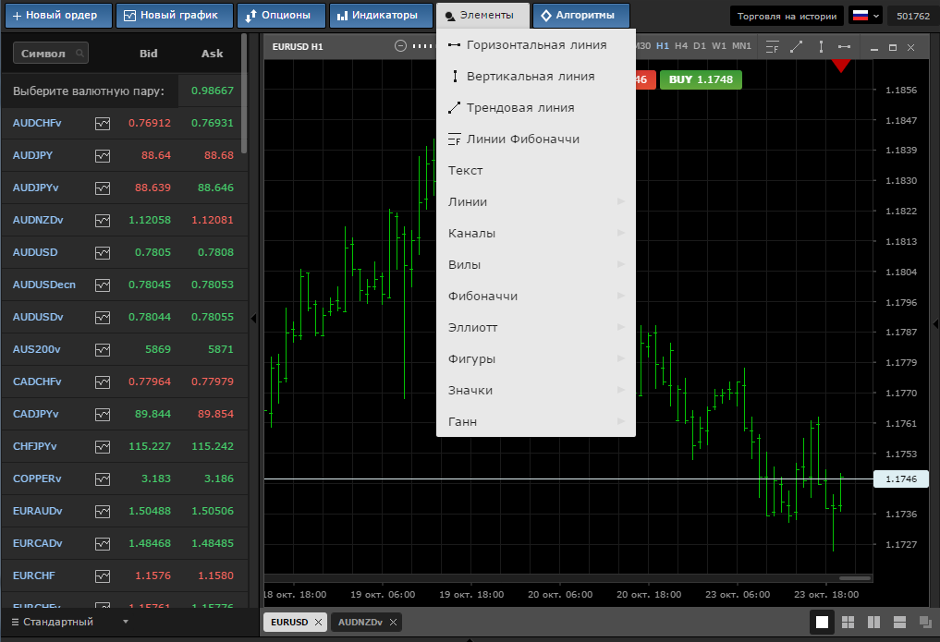
To add the desired graphic element, you need to select it from the list, and then use the mouse pointer to place it in a specific place on the chart.
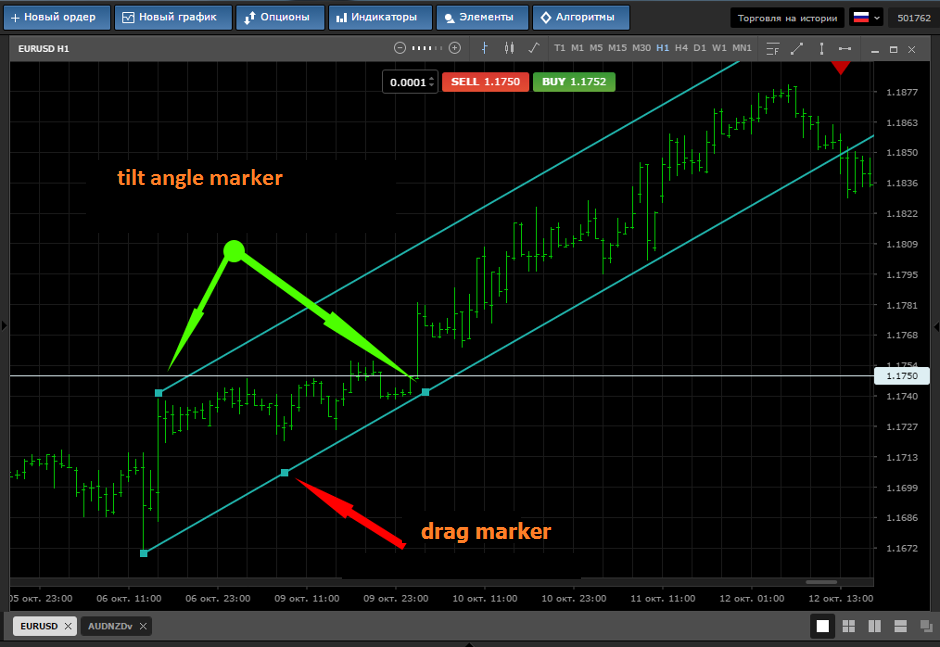
The added item can be changed, for this it must be selected with a mouse click - control markers will appear. For example, a trend line has three points. The middle marker is designed to move the element on the schedule, and the two extreme ones allow you to adjust the level of the beam.
More complex figures, for example, Schiff's pitchfork, have more than 3 control markers. And the simplest (icons, arrows) are only one central, allowing you to change their position.
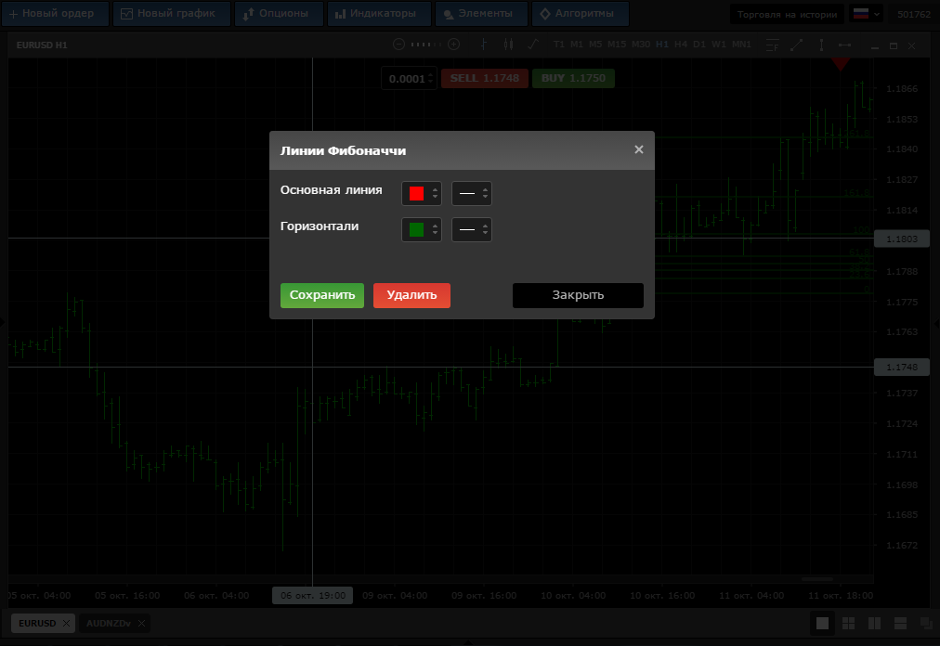
Added objects can be customized as you wish - change the color, line thickness and other parameters. To open the properties window, select the desired element and call the context menu with the right mouse button.
To remove a figure from the chart, select it with the mouse and click on the keyboard “Delete”, it can also be done from the context menu.
The principles discussed above apply to all graphic elements. You can view the list of all objects added to the chart in Mobius Trader by right-clicking in any free place on the chart - the “List of objects” menu. In this way, you can open the properties of a particular element or completely clear the chart of all the constructions, including indicators and algorithms.