
 Russian
  中文
中文  العربي
  Bahasa Indonesia
 Types of Indicators
Indicators serve as an auxiliary tool for the trader and at the same time as the main assistant for conducting market analysis. They give signals that you can rely on when making forecasts. All indicators of technical analysis work on the principle of mathematical transformation of past price values. As a result, a forecast is issued for the near future an upward / downward trend or flat. But it should also be noted that there are other indicators, for example, informational, which display information about trading sessions or key events in the market. However, they are not very popular, so they do not fall into the standard list.
Varieties of indicators
It will be about indicators of technical analysis. Existing solutions can be divided into 3 categories: trend indicators, oscillators and volumes. Also recently, new tools that are called "psychological" have begun to gain popularity. They display the behavior of traders, for example, the percentage of currently open sell and buy transactions. Trend indicators confirm current market trends, while oscillators predict a cessation and reversal of movement.
In addition, there is a purely conditional separation of tools. This is done for the convenience of users. There are 10 categories in the Mobius Trader terminal, ranging from trending instruments to informational ones.
Trending
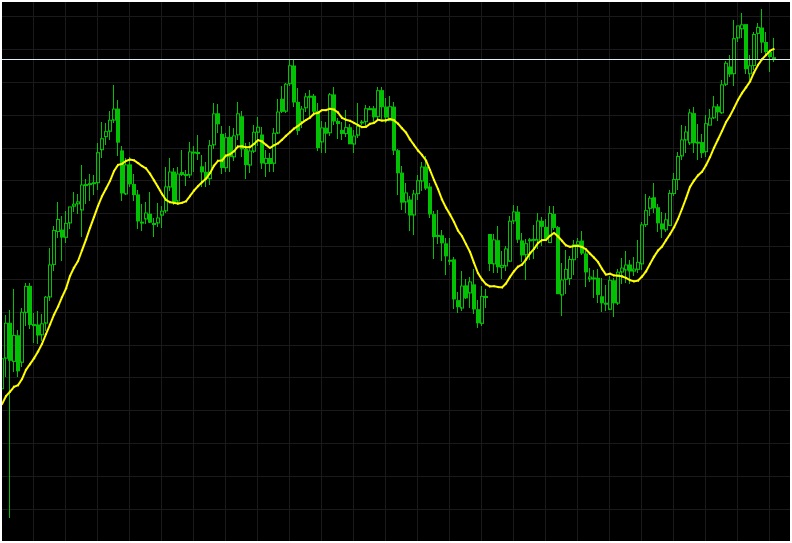
Trend indicators are tools to find the points of origin and end of trends. Also, with their help, you can determine the approximation of the reversal of the active price trend. An example of a popular trend indicator is Moving Average, Bollinger Bands or Parabolic SAR.
A characteristic feature of tools from this category is the presence of some delay from the current situation on the market. However, their signals, in contrast to oscillators, are characterized by increased accuracy. With their help, it is difficult to predict price behavior in the future, they just show the current situation in the market.
The above picture shows the Moving Average trend indicator. A sign of the beginning of a trend is the intersection of the moving average with price bars.
Oscillators
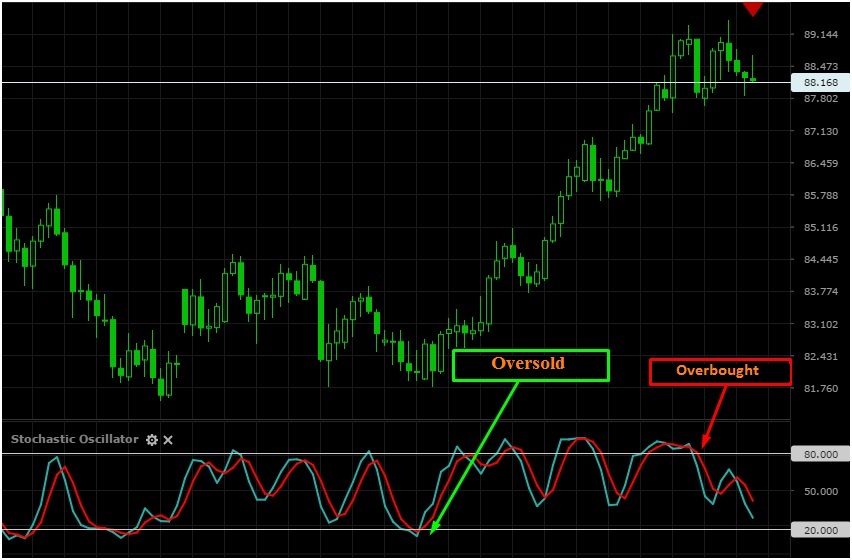
Oscillators allows you to determine the overbought and oversold zones, which usually precede a close reversal of trends. Unlike trend indicators, they work at a certain lead. Therefore, traders can enter the market at the time of the inception of the movement, and not in its active phase. The readings of the oscillators are determined by past values of the price, so they often give false signals.
The picture shows a popular oscillator - Stochastic. Reaching levels 20 and 80 signals that the market is in the oversold zone or, accordingly, overbought. Also, the signal of the indicator about a trend reversal is the intersection of lines.
Volumes
The volume indicator partially falls under the definition of “psychological” tools. It displays information on the number of transactions completed and their volume. This type of instrument was originally used in other financial markets. On Forex, the histogram of the volume indicator is built taking into account only the number of completed transactions. Therefore, the real picture of what is happening is only partially sanctified.
Volumes are usually displayed as a color bar chart. The height of the bars indicates the number of transactions completed, and the color indicates the percentage of the volume of transactions on the market, green - more than the previous value, red - less.