Russian
  中文
中文  العربي
  Bahasa Indonesia
 The impact of economic indicators
What are fundamental indicators
Macroeconomic indicators are expressed in numbers and characterize the state of the economy, its properties and the quality of economic processes. These indicators, or as they are also called indicators of macroeconomic statistics, by their meaning can be divided into two groups, quantitative, which show the absolute value and qualitative, which demonstrate the difference or ratio of the two values.
Main purpose
First of all, they are needed as feedback for the government, which sets the political course, as well as the Central Bank, which is engaged in monetary regulation. Based on these data, the governing bodies may decide to adjust the legal framework or change the tax system. With the help of these indicators, investors and participants in financial markets can assess macroeconomic risks and decide on transactions with financial assets.
Main characteristics
GDP (GDP)
The main indicator and basic element of the system of national accounts is the Gross Domestic Product. GDP is the total market value of the final goods and services created during the year in the country by all registered business entities in it. The growth of this indicator indicates an increase in the pace of economic development. A qualitative derivative of GDP is the change that is usually expressed by comparison over a certain period, for example, the quarter of this year to the quarter of the previous one. In this case, the error associated with the seasonal factor can be avoided.
Non-farm Employment Change (NFP)
One of the most important indicators of the American economy is a qualitative indicator the change in the number of people employed in the non-agricultural sector (Non-farm payroll, NFP). Published by the Bureau of Labor Statistics (U.S. Bureau of Labor Statistics) once a month. Official data is calculated according to information received from corporations that fill out new payrolls at the time the employee is hired.
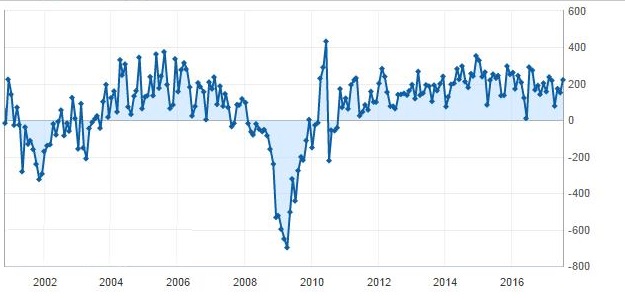
Outlawing agriculture, the seasonal factor is also being addressed. For example, when additional labor is required for harvesting and sowing, a seasonal increase in employment occurs and the general data are distorted. This indicator is important because the number of working people in the country is a direct indicator of the strength of the economy. The bulk of GDP is consumed domestically, as is produced. With the growth of employment, the expenses of the population also increase, and as a result, the GDP. NFP Schedule:
Inflation (CPI)
Inflation is calculated based on the Consumer Price Index (CPI) and is officially published by the Bureau of Labor Statistics of the US Department of Labor. In fact, it is a “basket” of several hundred goods and services selected by the Bureau of Labor Statistics. The consumption basket includes food, clothing, electricity, housing and vehicles, medical care, recreation and education in certain proportions. To obtain adequate information about changes in the level of costs, the basket should correspond to the real average structure of consumption per person. The inflation indicator is used to calculate the successful moment of regulation of the economy using a key rate or other measures, which helps to avoid a strong increase in the money supply.
Macro Statistics Calendar
All fundamental data are published with a certain frequency, and are collected in a calendar of macro-statistical indicators. Typically, brokers provide it to their customers as an additional service.
In addition to the indicator name in the calendar, there is also periodicity, importance, and consensus forecast. Significance is usually calculated in points as it grows from 1 to 3. With the maximum score after publication, strong volatility of the country's stock or foreign exchange market is possible. The expected value is calculated as a consensus forecast based on a survey of leading analysts of financial companies and banks.
The impact of fundamental indicators on the market
The publication of the indicator may have the main impact on the growth of market volatility in the case when the actual value does not strongly coincide with the consensus forecast that has already been played by bidders and taken into account in the price. Then, not only sharp market movements will increase volatility, but market participants can change the composition of their portfolios and this will lead to a reversal of the current trend.
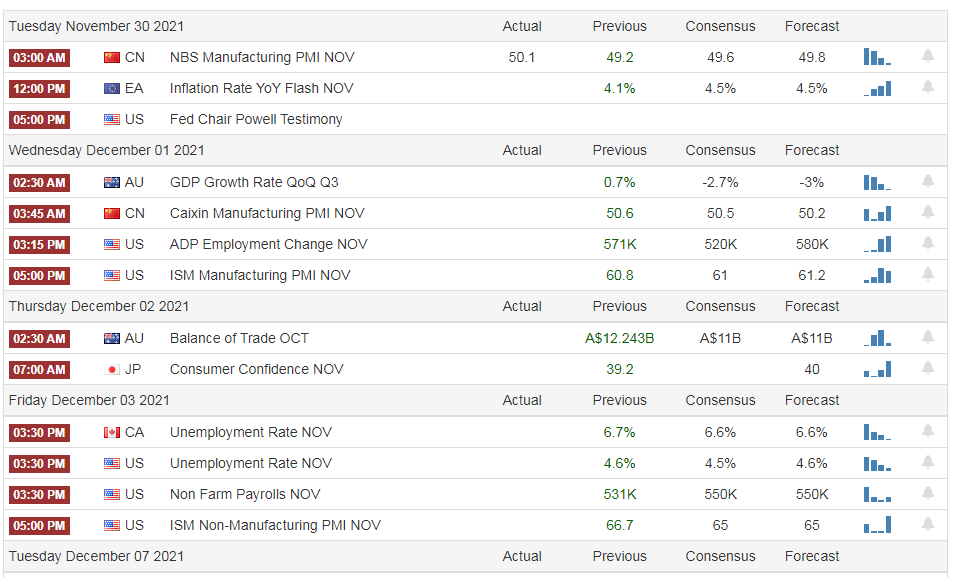
For example, analysts expected an increase in the number of people employed in the non-agricultural sector of the United States of 190 thousand, and in fact the figure came out at the level of 151 thousand, as in the macro statistics table below:

At the time of publication and after it, a strong surge in market quotes is visible on the chart of the euro / dollar pair:
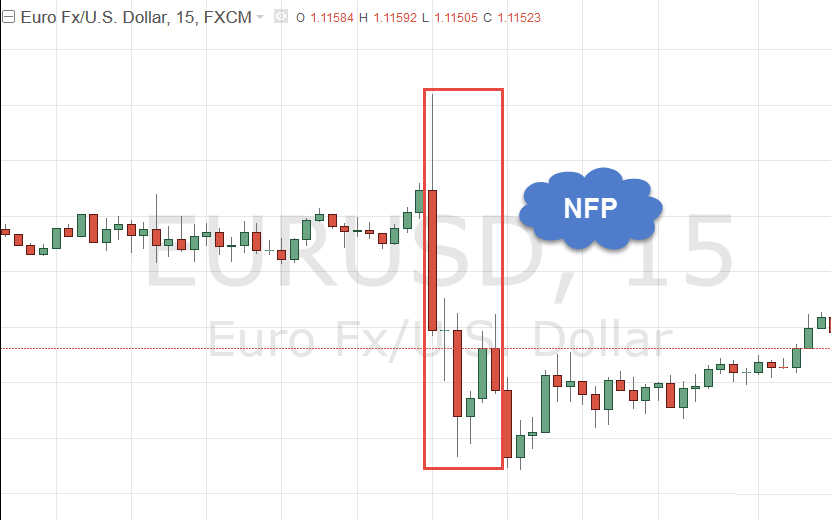
At this moment, most market participants react to changes, trading takes place with the maximum volumes for a long time.
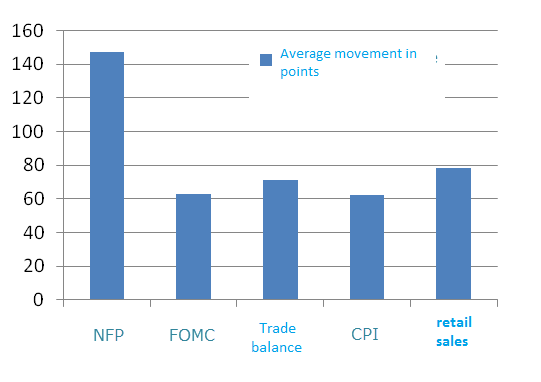
In addition to NFP, there are several more key events published with a frequency of one month that can have a similar effect on the course of trading. The diagram below shows the average volatility spikes during the publication of macro statistics: