
 Russian
  中文
中文  العربي
  Bahasa Indonesia
 Japanese candles
To transmit information in graphical form about the state of the market, there are three main types of charts: candlestick, bar, linear. One of the most common and informative for analyzing the market situation is the candlestick chart.
Why is this type of chart so useful? How is a candle formed? What opportunities does the trader provide using candles in graphical analysis? You will find the answer to these, as well as to many other questions, today.
What are Japanese candles?
Japanese candles belong to one of the varieties of the interval chart (the ability to display a single candlestick for a certain time period). So a candle with an interval of 5 minutes will give information about how the market behaved during this time. The formation of the candle itself is due to incoming ticks (the minimum price change for a particular asset).
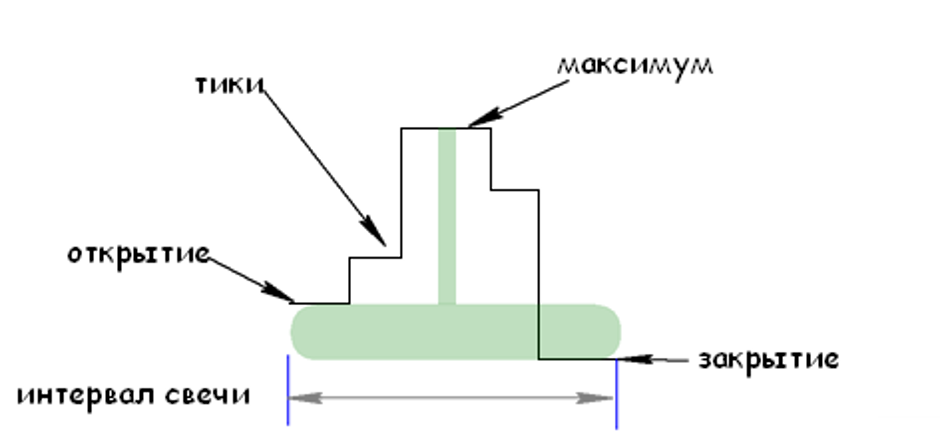
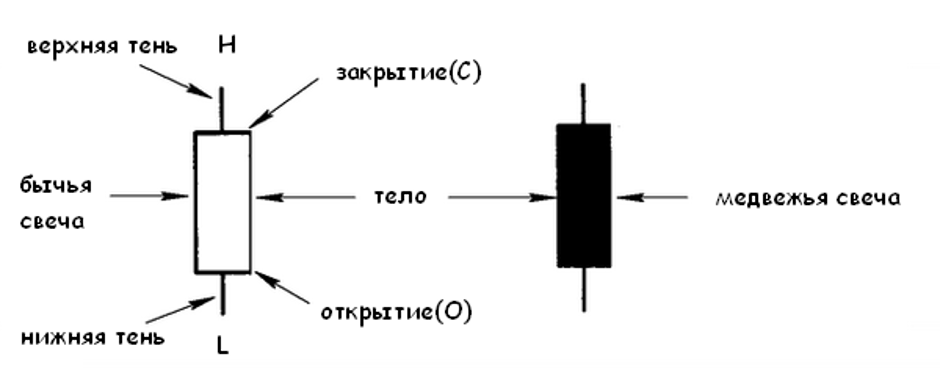
A candle usually consists of a body and shadows, and has four parameters:
1. Open price (Open), indicated by the letter "O".
2. The price of the maximum (Hight) is indicated by the letter "H".
3. The price of the minimum (Low), indicated by the letter "L".
4. The closing price (Close) is indicated by the letter "C".
The body of the candle is the area between the opening and closing prices, limited by time. Shadows are the minimums and maximums of the candle, in the case when they do not coincide with the prices of opening or closing. If the maximum or minimum coincides with the opening or closing, it is considered that the shadow is absent.

The history of the mention of Japanese candles dates back to the 18th century A.D. When the Japanese Munehisa Honma used the candle price information on rice for trading on the Japanese futures exchange. Having made a fortune in trading rice, Honma formulated the basic philosophy of candlestick analysis, called the Sakata method. The basic rules of which form the foundation of the current analysis of candlestick patterns. The popularity of Japanese candles began to grow with the development of technical analysis in the 20th century thanks to the theory of Charles Dow. However, the greatest surge in popularity occurred only in the 80s of the 20th century, thanks to Steve Nisson, who began to popularize this type of chart in the West for analyzing the market situation.
An analysis in which an assessment of the market situation with the help of Japanese candles is called a candlestick. Candlestick method of assessing the market situation refers to one of the varieties of graphical analysis, which in turn is part of the technical.
How can candlestick information help predict movement?
To begin, let's figure out what types of candlesticks are.
According to the structure of formation, Japanese candles are divided into 9 types.
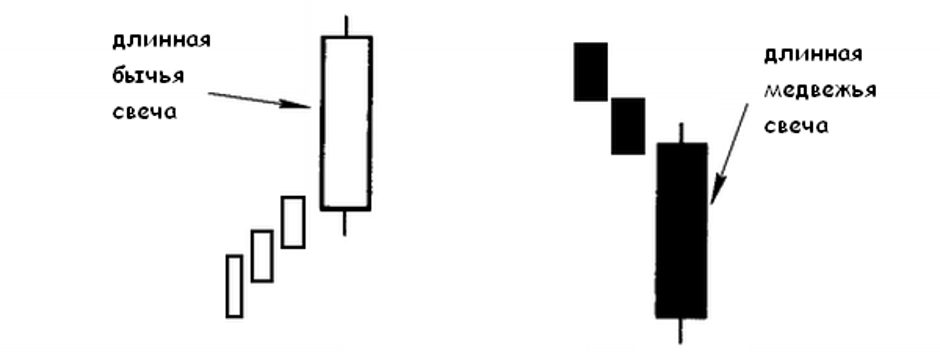
1.Long.
Long candles are called, the body of which is much larger compared to the previous 5-10.

2. Short.
Short are called candles, whose body is much smaller compared to the previous 5-10.
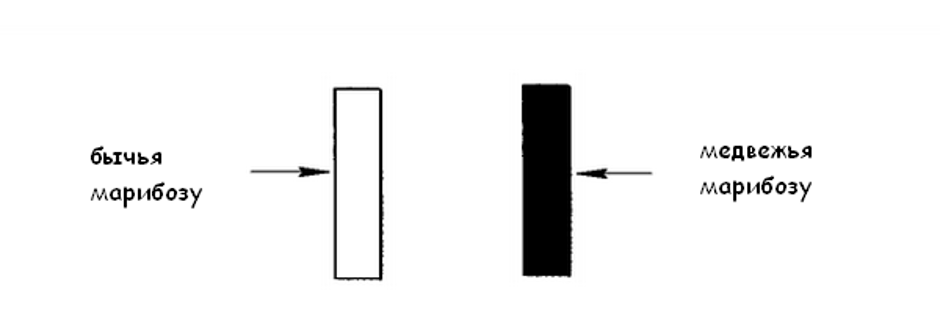
3. Maribose.
Maribosa is called long candles without shadows.

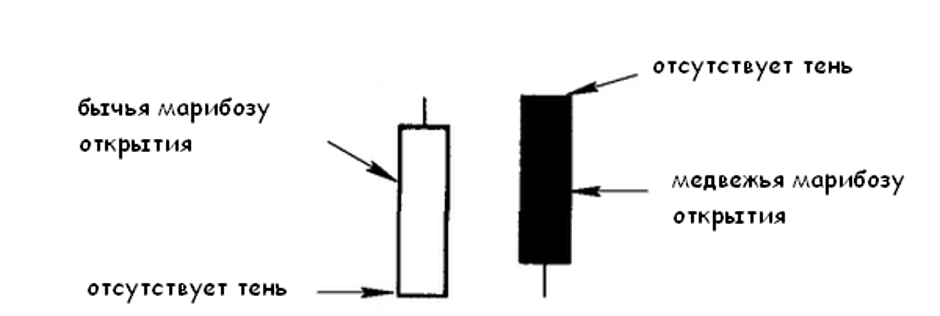
4. Maribozu discovery.
Opening maribozu are called candles that have no shadow on the side of the opening. In this case, there is a shadow from the closing side.
5. Maribose closure.
Closing maribose are called candles that have no shadow on the closing side. In this case, there is a shadow from the side of the opening.
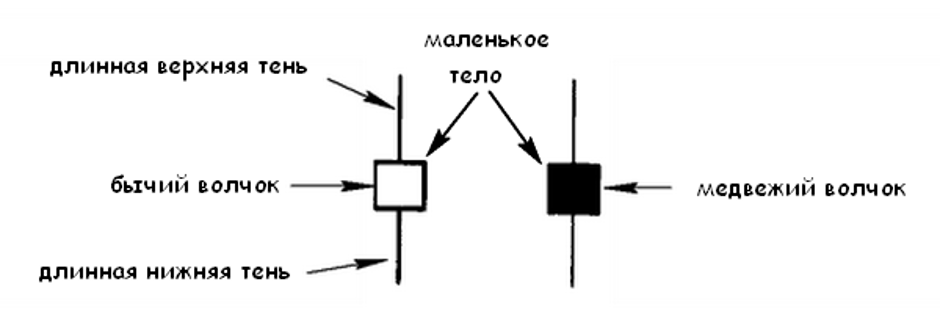
6. Tops.
Spinning tops are candles with a small body and long upper and lower shadows.

7. Doji.
Dodges are candles with the same opening and closing prices, or the difference between them is only a few ticks.
There are several types of doji:
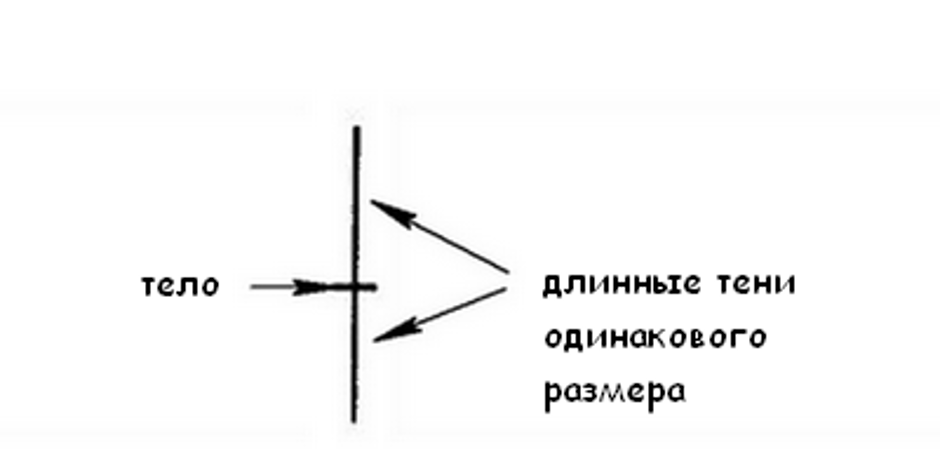
7.1. The long-legged doji. Long shadows of the same size, while the body of the candle is in the middle.
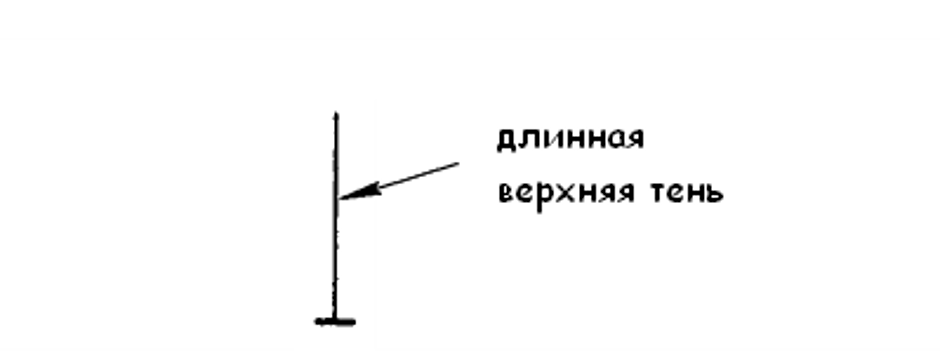
7.2. Tombstone (Tohba). A long upper shadow, in the absence of a lower one.
7.3. Doji Dragon (Tombo). This is the opposite tombstone candle, with a long lower shadow in the absence of the upper.
7.4. Doji four prices. A candle in which all four price indicators (opening, closing, maximum, minimum) match.
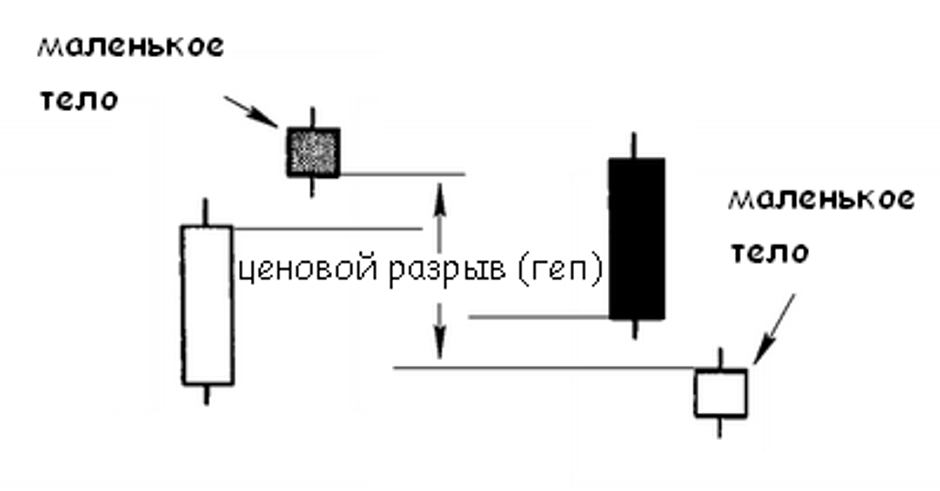
8. Stars (gosi).
Stars are candles with a small body that appear after price gaps (gaps)

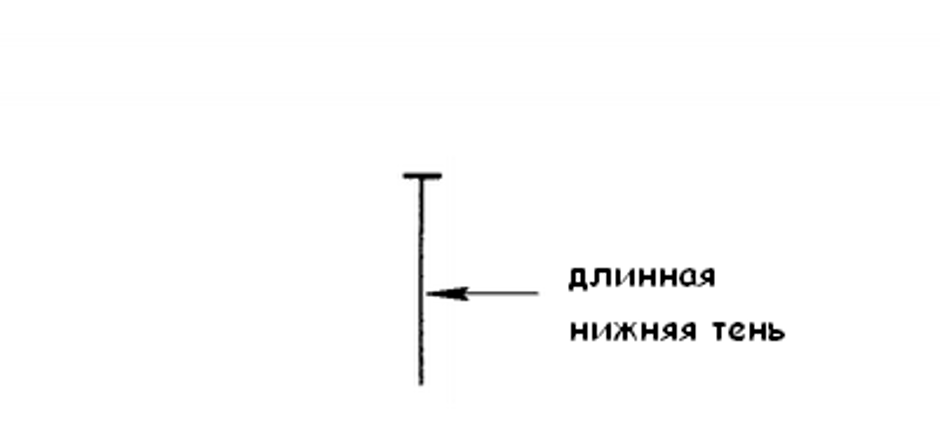
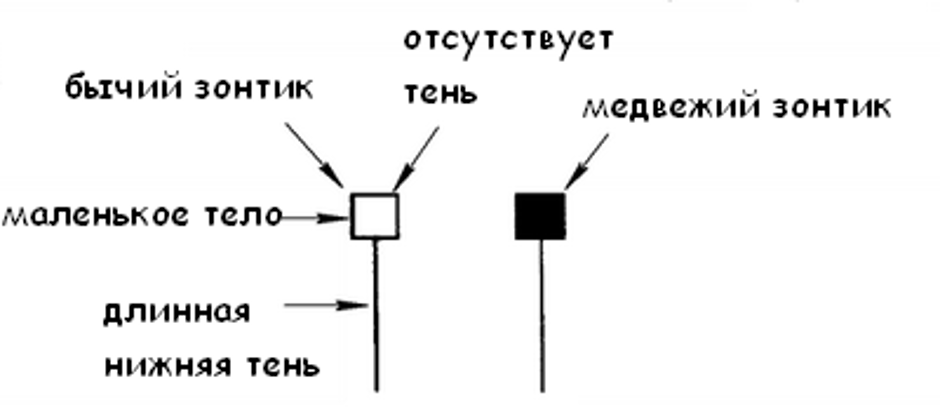
9.Paper umbrellas (caracas).
Paper umbrellas are candles that have a small body with a long lower shadow, in the absence of an upper one.
Now that we’ve figured out the basic types of Japanese candles. It is time to get acquainted with the models that they can form, as well as the forecasting capabilities based on them.
Basic reversal patterns.
These models are used to analyze a possible trend reversal.
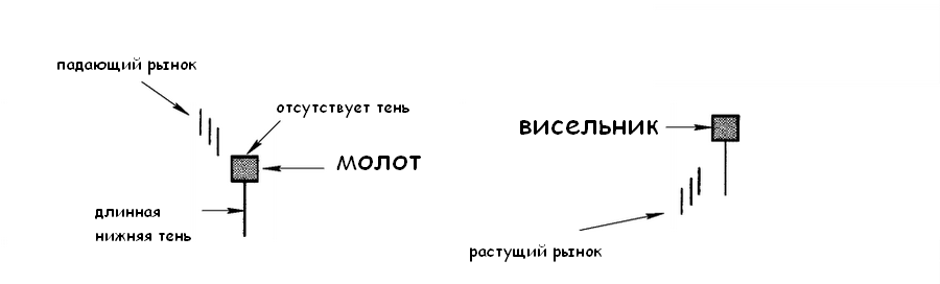
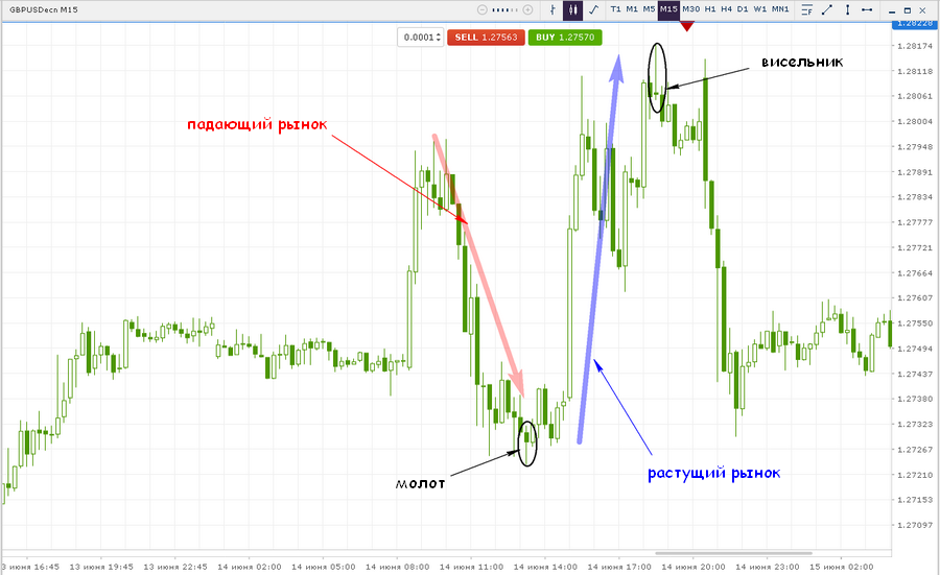
1. Hammer (tonkachi) and a gallows (takuri - lift on a rope).
Hammer - a model that appears in a falling (bearish) market and ends with a “paper umbrella” candle.
A gallows is a model that appears in a growing (bullish) market, also ending with a “paper umbrella” candle.
Moreover, the color of the “umbrella” does not matter to identify this model.
The main criteria for identification are:
1. The presence of a trend.
2. The long lower shadow.
3. The absence or very small length of the upper shadow.
The figure below shows examples of testing these models.
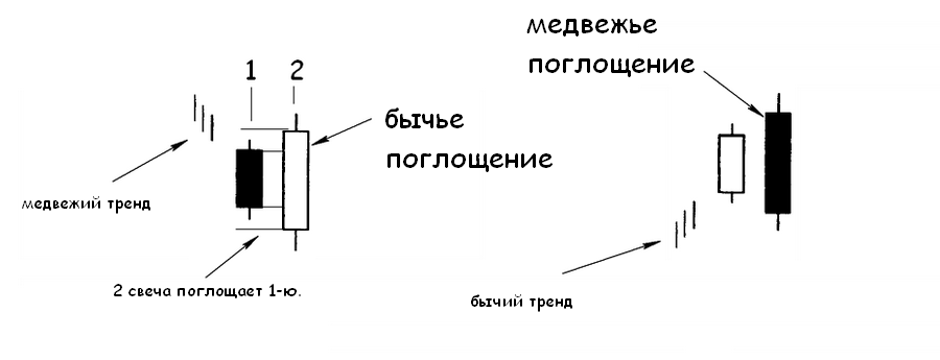
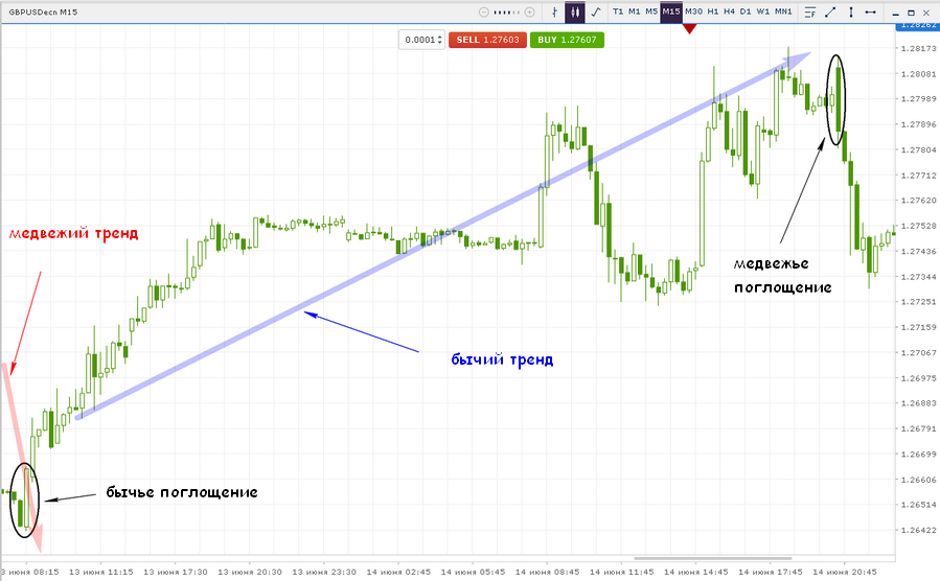
2. Absorption (Tsutsumi).
This reversal model consists of 2 candles of different colors (character). At the same time, the 2nd candle with a large body completely absorbs the 1st, which is small in size.
There are two types of takeovers:
2.1. A bullish takeover occurring in a bear market, with the takeover candle being bullish.
2.2. A bearish takeover occurring in a bull market, while the takeover candle is a bearish one.
The main criteria for identifying a model are:
1. The presence of a pronounced trend
2. The body of the 2nd candle should absorb the body of the 1st.
3. The direction of the 1st candle should coincide with the previous trend. In our case, for a bullish trend, the candle should be increasing (white), for a bearish trend it should be decreasing (black).
4. The 2nd candle should be opposite in character (color).
The figure below shows examples of testing these models.
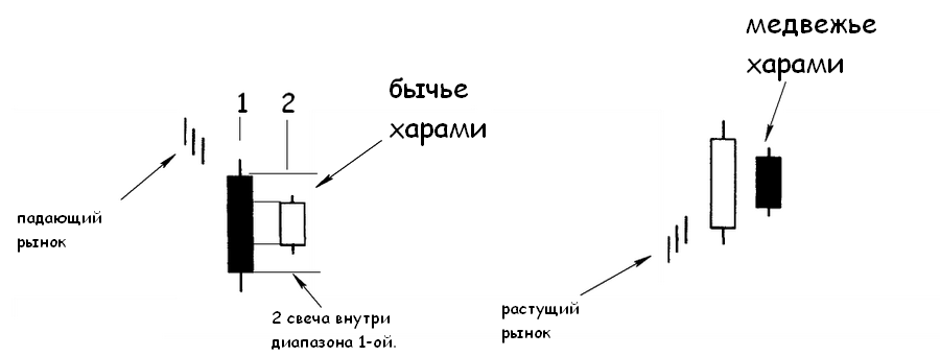
3.Harami.
This model arises after a strong trend, ending with 2 candles, the first of which is long and the second is short. In this case, the body of the 2nd candle is inside the body of the 1st. It is also desirable that the direction of the long candlestick coincides with the previous trend.
There are two kinds of harami:
3.1. Bearish harames arising in a growing market, while the 2nd candle should be bearish.
3.2. Bullish harami that occurs in a falling market, while the 2nd candle should be bullish.
The main criteria for identifying a model are:
The presence of a strong trend in front of a long candlestick.
It is desirable that the direction of the long candlestick coincides with the trend.
The body of the short candle should be inside the body of the long one.
The directions of the 1st and 2nd candles should be different.
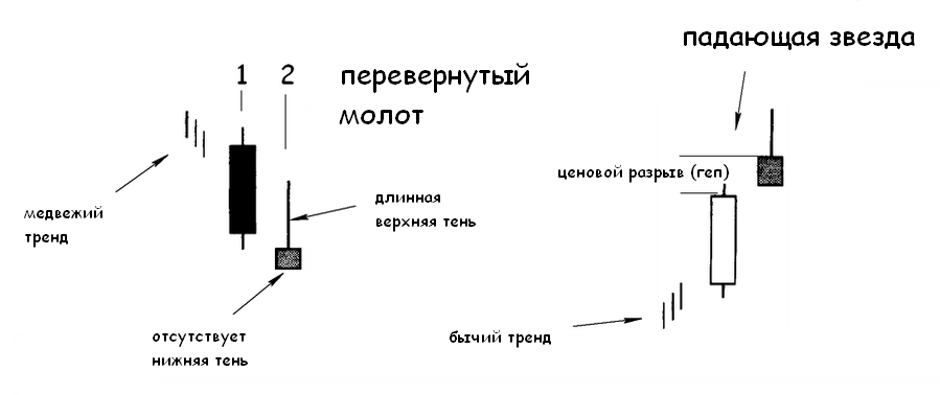
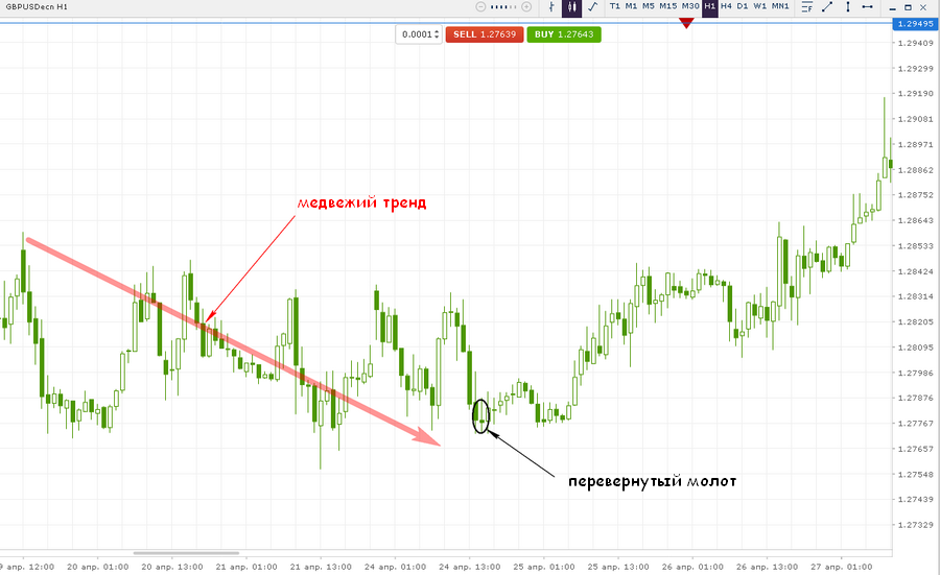
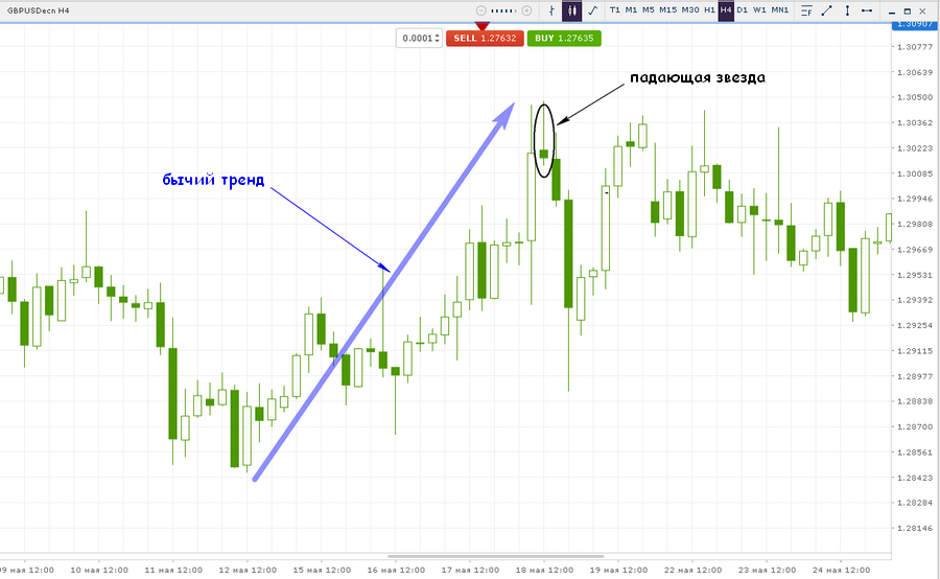
4. Inverted hammer and shooting star (toba and barefoot)
This model consists of one candle “paper umbrella”, which, depending on the previous trend, will be identified as an inverted hammer or a shooting star. In this case, the hammer is a bullish reversal formation, and the shooting star is bearish. It is worth clarifying that for a shooting star model, a prerequisite is the presence of a price gap (heap) in front of it. For the hammer, this condition is not critical.
The criteria for identifying this model are:
1. The presence of a pronounced trend.
2. For the shooting star model, a price gap is required.
3. A small body with a long upper shadow.
4. The complete absence of the lower shadow, or its length is very small.
The figures below show examples of testing these models.
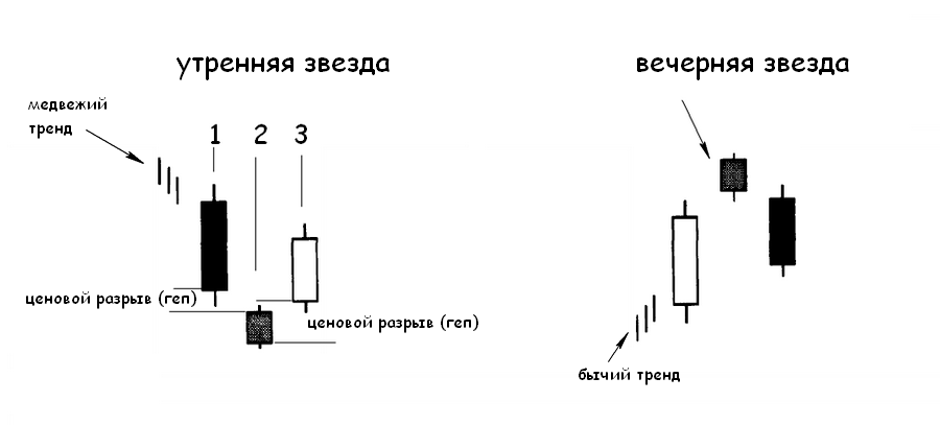
5. Morning and evening stars.
This model consists of 3 candles, which, depending on the previous trend, will be identified as a morning star, or as an evening star. The morning star belongs to the bullish reversal pattern and consists of 3 candles. The 1st of the candles supports the downtrend, is long and black (bearish). The 2nd candle has a small body without obvious shadows, that is, it is a star. At the same time, there is a price gap (hep) between the bodies of the 2nd and 1st candles. The last of the 3 candles is white (bullish) and also has a gap with the body of the second.
The evening star belongs to the bearish reversal pattern, also consisting of 3 candles.
But at the same time, the 1st of the candles supports the uptrend, is white (bullish). And the last of the candles is black (bearish) long.
The criteria for identifying this model are:
The 1st candle should always be long and support the previous trend.
The presence of a price gap between the 1st and 2nd candles.
The difference in the nature of the 1st and 3rd candles.
The presence of a price gap between the 3rd and 2nd candles.
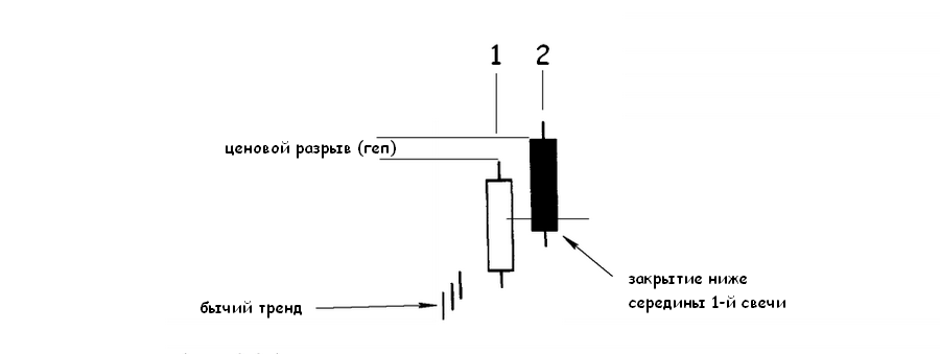
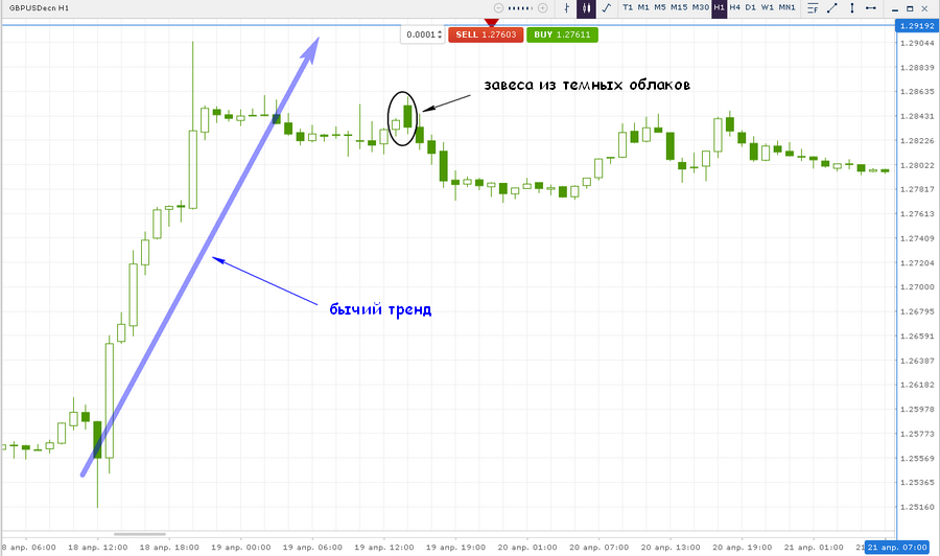
6. A curtain of dark clouds (cabin).
This reversal pattern is bearish, is formed in a growing market and consists of 2 candles. 1st is white (bullish). 2nd - black (bearish). Moreover, the opening of the 2nd candle occurs with a gap above the maximum of the 1st. Closing occurs just below the middle of the body of the 1st candle.
The criteria for identifying this model are:
1. The presence of an uptrend.
2. A long white (bullish) candle.
3. Opening of the 2nd candle with a gap (hep) above the maximum of the 1st.
4. Closing of the 2nd candle inside the body of the 1st, below the middle.
The figure below shows an example of testing this model.
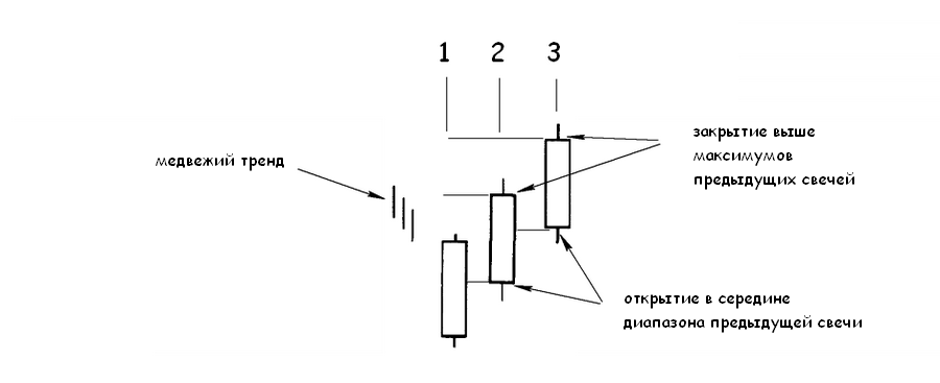
7. Три белых солдата (ака санпей)
Данная модель является бычьей, формируется при нисходящем тренде и состоит из 3-х длинных белых свечей (бычьих) таким образом, что закрытие каждой из них выше предыдущей. При этом желательно, чтобы открытие каждой из свечей происходило в середине диапазона предыдущей.
The criteria for identifying this model are:
The presence of a downtrend.
Three long white (bullish) candles with the opening in the middle of the previous range, as well as closing above the previous
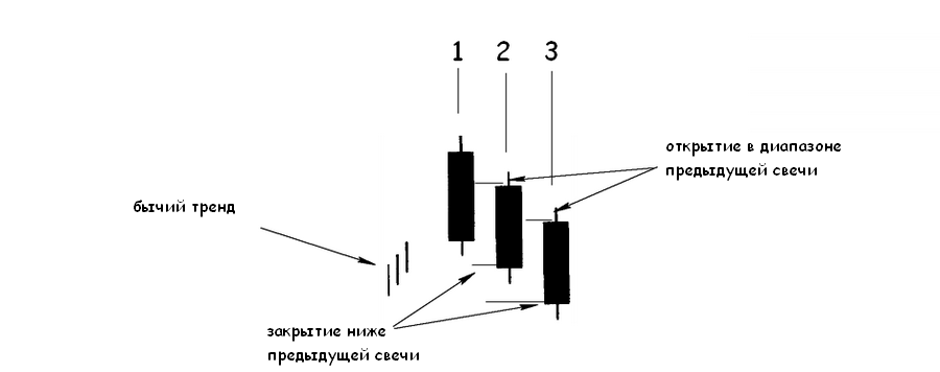
8. Three black crows (sanba garasu).
This reversal model is an analogue of three white soldiers. The model consists of 3 long black (bearish) candles and occurs after a bullish trend. At the same time, the opening of each of the candles is in the range of the previous one. A close below the previous candle.
The criteria for identifying this model are:
The presence of an uptrend.
Three long black (bearish) candles with the opening in the middle of the previous range, as well as closing above the previous one.
The main continuation models.
These models are used to analyze the possible continuation of the current trend.
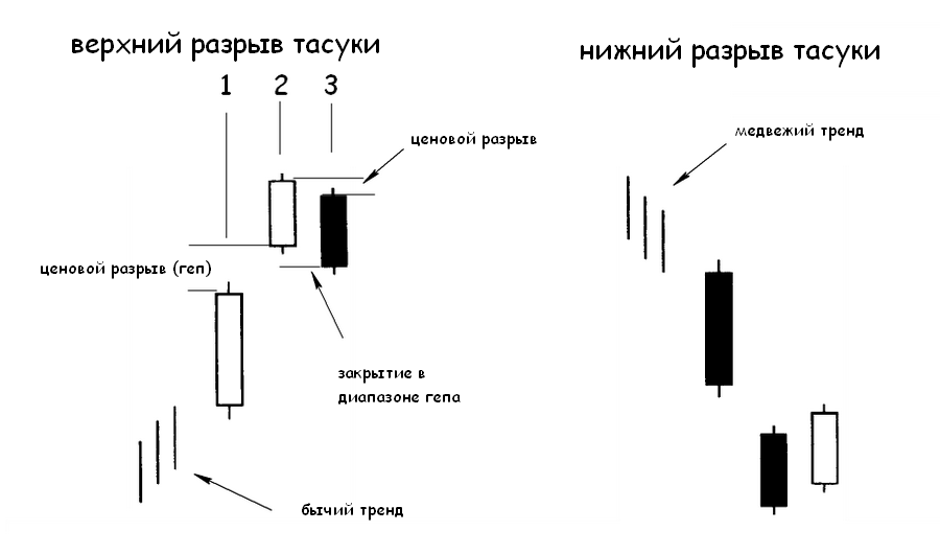
1. The upper and lower tasuki gap.
This model consists of 3 candles, which, depending on the previous trend, will be identified as the upper or lower tasuka gap.
The upper tasuki gap refers to the bullish continuation formation. In this case, the first two candles are bullish and there is a gap between them (hep). The 3rd candle also has a price gap relative to the 2nd candle. In this case, the opening of the 3rd candle occurs below
closing 2nd. Closing of the 3rd candle occurs below the opening of the 2nd. In this case, the closing area of the 3rd candle is in the gap zone located between the 1st and 2nd candles.
In the case of the lower tasuka gap, the formation is bearish and is formed during a downtrend, with the appearance of 2 bearish candles with a price gap between them. After that, a bullish candle is formed in such a way that its opening is higher than the previous one. In this case, the closing of the last candle is in the gap area of the 2 previous candles.
The criteria for identifying this model are:
The presence of a pronounced trend. In this case, there are two candles with a gep, in the same direction as the trend.
The 3rd candle differs in direction from the previous 2 and opens inside the body of the 2nd candle.
Closing of the 3rd candle occurs inside the hep.
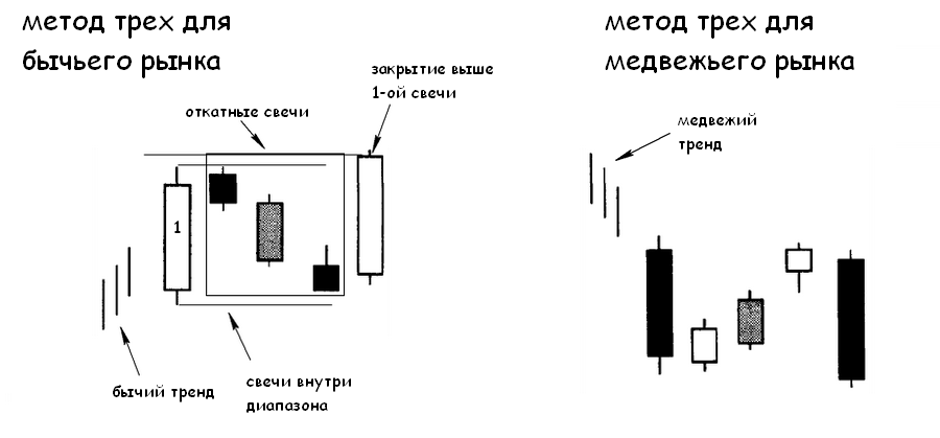
2. The method of the three (banare sanpoo odatecomi).
This continuation model consists of 2 long ones directed towards the prevailing trend and several retracting candles located between them. At the same time, retractable candles are anti-trending and do not go beyond the boundaries of the range limited by the maximum and minimum of the 1st candle.
The three method can be either a bullish continuation model or a bearish one.
The criteria for identifying this model are:
1. The 1st long candle is directed towards the trend.
2. Retractable candles with small bodies, preferably the opposite color (direction). Are within the range of the 1st candle.
3. The last candle closes in the direction of the trend, above the maximum of the 1st candle for the bullish pattern and below the minimum for the bearish one.
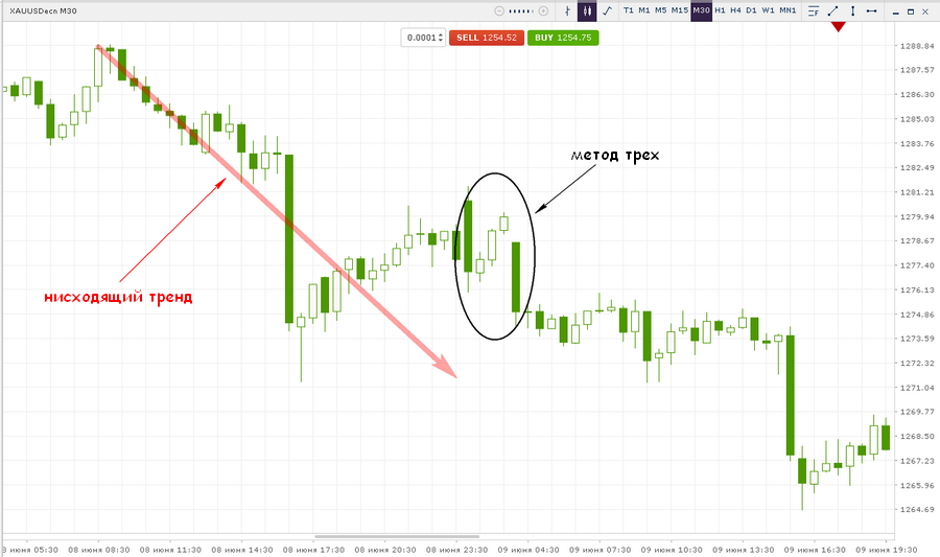
The figure below shows an example of testing this model.
3. Adjacent white candles (narabi aka).
This model consists of 3 candles. In the case of the bullish model, all three candles should be white (bullish). Moreover, the opening of the 2nd candle occurs with a gap relative to the closure of the 1st. The 3rd candle should also have a price gap with the closing of the 2nd candle.
When forming a bearish pattern, the 1st candle should be black (bearish). In this case, there must be price gaps between the opening of the 2nd candle and the closing of the 1st. And also between the opening of the 3rd candle and the closing of the 2nd.
The criteria for identifying this model are:
1. Price gap in the direction of the trend.
2. The 2nd and 3rd candle should be white (bullish).
3. Opening of the 3rd candle, with a gap in the area of the opening of the 2nd candle.
4. Separating candles (iki chigai sen).
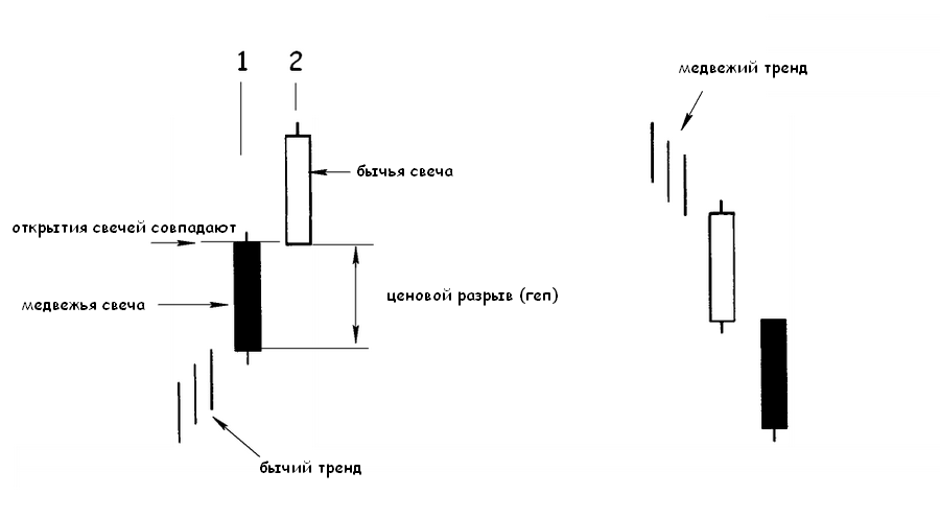
This continuation model consists of 2 candles in different directions. There is a price gap between them, so that the opening price of both candles matches.
For a bullish model, the 1st candle should be bearish, and the 2nd bullish.
For a bearish model, the 1st candle should be bullish, and the 2nd candlestick.
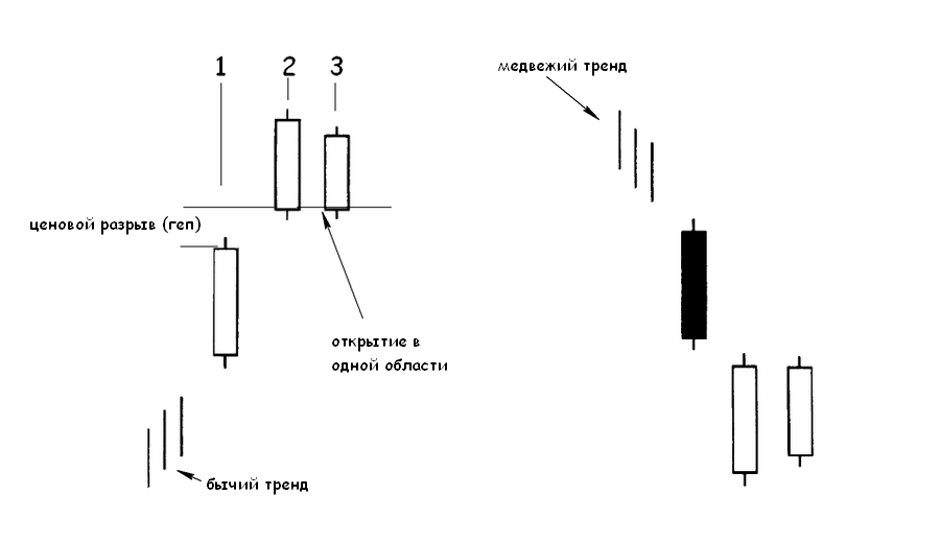
The criteria for identifying this model are:
1. The presence of a trend.
2. The 1st candle should be anti-trend.
3. 2nd candle on the trend.
4. Price gap between the closing of the 1st candle and the opening of the 2nd.
5. The opening price of the 2nd and 1st candles is the same.
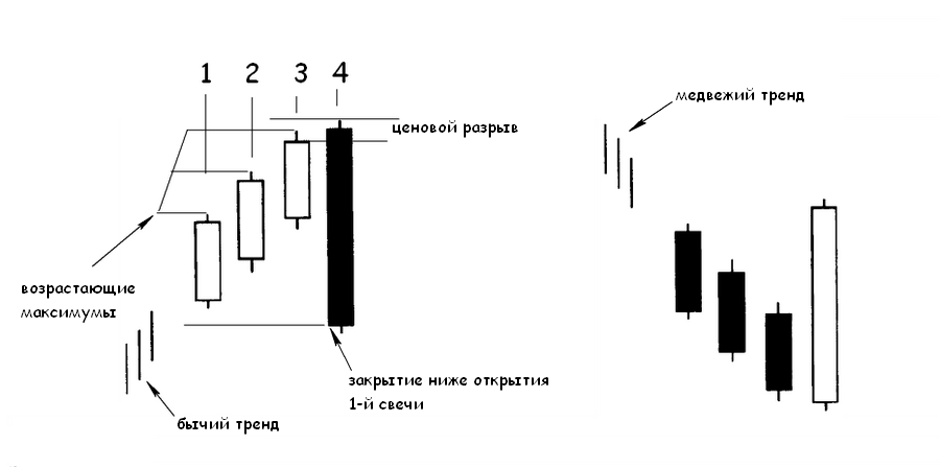
5. Triple strike.
This model consists of 4 candles. In this case, the first three candles go in the direction of the prevailing trend, and the 4th candle is the anti-trend. Moreover, the 4th candle should cover the entire range of the past 3 candles.
A bullish model of a triple strike is formed by 3 white (rising) candles, the maximum of each of which is higher than the previous one. The 4th candle is black (bearish), has a price gap, as well as a higher maximum relative to the 3rd. In this case, the closure of the 4th candle occurs below the opening of the 1st.
A bearish model of a triple blow is formed by 3 black (lowering) candles, the minimum of each of which is lower than the previous one. The 4th candle is white (bullish), has a price gap, as well as a lower minimum relative to the 3rd. At the same time, the closure of the 4th candle is higher than the opening of the 1st.
The criteria for identifying this model are:
1. The presence of a trend with a combination of 3 candles in the direction of the trend.
2. The 4th candle is anti-trend and covers the range of the past 3.
3. Closing of the fourth candle occurs below the opening of the first - for the bullish model, or above the opening - for the bearish model.
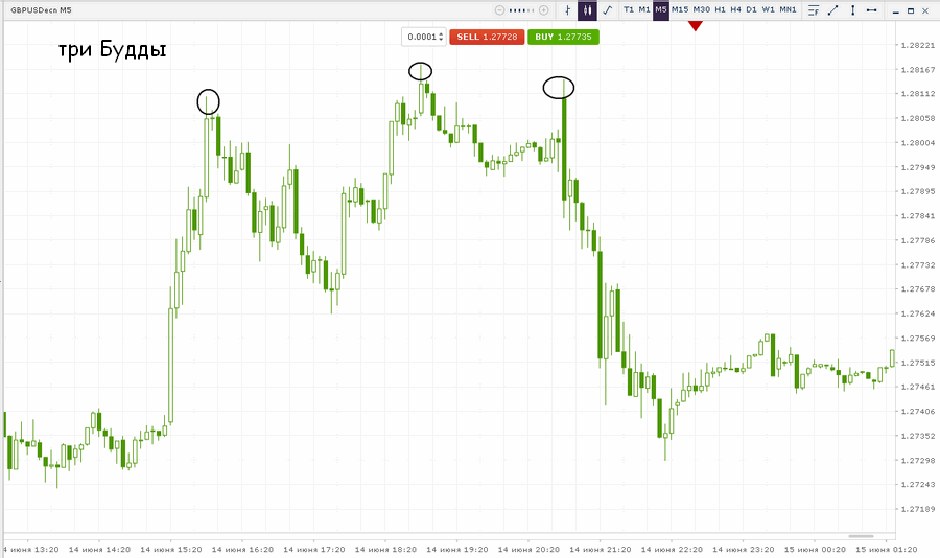
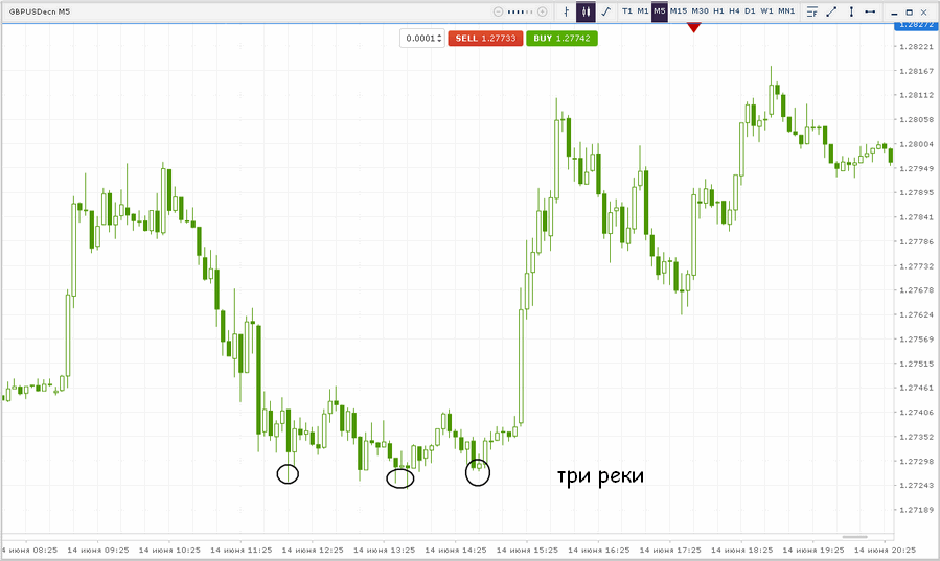
In addition to the considered basic reversal and continuation models, consisting of several candles, there are more extensive formations in their structure. Which, in turn, can cover from 50 or more candles. These models provide an understanding of the general market background, without focusing on individual candles. The most famous of these formations are:
The top of the Three Buddhas. This formation coincides with the classic triple top or with the traditional Head and Shoulders model.
Three rivers. This formation coincides with the classic triple bottom or with the inverted Head and Shoulders model.
Total.
Japanese candles, as well as analysis based on them, are one of the most reliable and time-tested methods for assessing the market situation. The structure of individual candles and models makes it possible to evaluate how buyers and sellers behaved at a certain point in time. In addition, due to extensive formations, using various time intervals of candles, you can always evaluate the possible development of events on the market.