
 Russian
  中文
中文  العربي
  Bahasa Indonesia
 Wave analysis. Reasons for the popularity of forecasting techniques
One of the most common types of analysis and forecasting of quotes is wave analysis. This type of analysis is widely used by traders who work with various assets, suitable for novice traders and professionals who have been trading for many years. Today we consider in detail the theory on which wave analysis is based, talk about the principles of its application, and also give examples of the practical use of this forecasting tool.
What is Wave Theory?
The author of the wave analysis is Ralph Nelson Elliott, an accountant, after retirement, he actively investigated the patterns that he constantly found on stock charts. He carefully watched the movement of quotes at different time intervals, and came to the conclusion that the market movement is a product of mass psychology, and the behavior of players in their mass depends on a number of psychological factors.
According to the conclusions of Elliott, the psycho-emotional state of the market mass can be in one of the following stages: expansion, enthusiasm, euphoria, calm, decline and depression. Moreover, each of these stages proceeds to the next in the described order. Based on the observations, the following conclusion was made: since the cyclical pattern in the behavior of the market is constant, then to determine the direction of the price movement it is enough to understand what stage it is currently at.
Principles of Wave Analysis
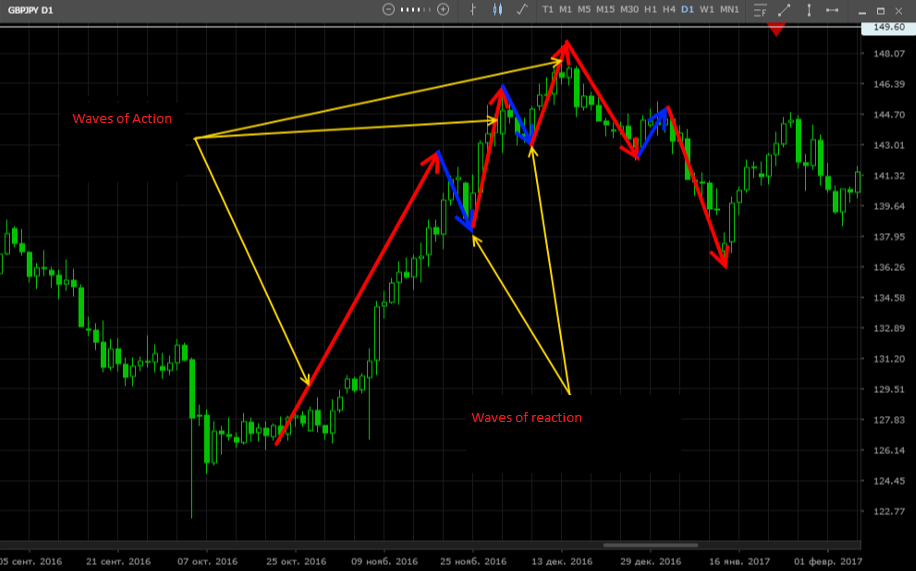
Visually, this pattern on the graph looks like waves, each large wave consists of many small waves and, in turn, is also an integral element of a more buoyant wave. The concept of "wave" in this theory means the directional movement of prices from a reversal to a reversal. The cyclic movement of quotes, determined by the psychology of market masses, fits into the wave pattern - each movement can be divided into five waves in the direction of the trend and three correction waves. The waves directed along the movement of the trend are called impulse (acting), and the waves against the trend are called correctional (counteracting):
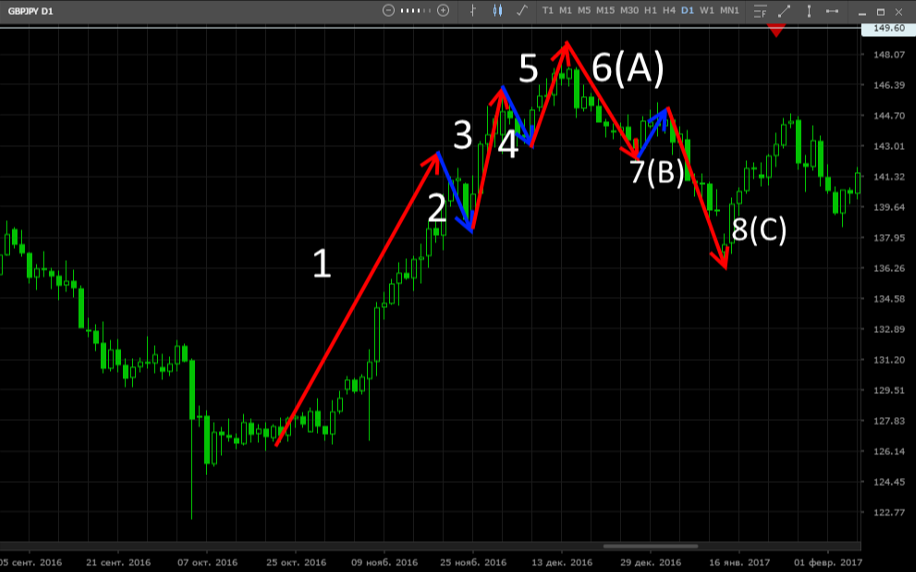
According to the theory, the largest price movement (the entire history of quotes) is called the Supercycle and this movement consists of eight waves. Each wave, in turn, also consists of eight waves, and so on “decreasing”, to the smallest price movements. Eight waves are marked on the chart - five on the growing movement and three waves on the correctional:
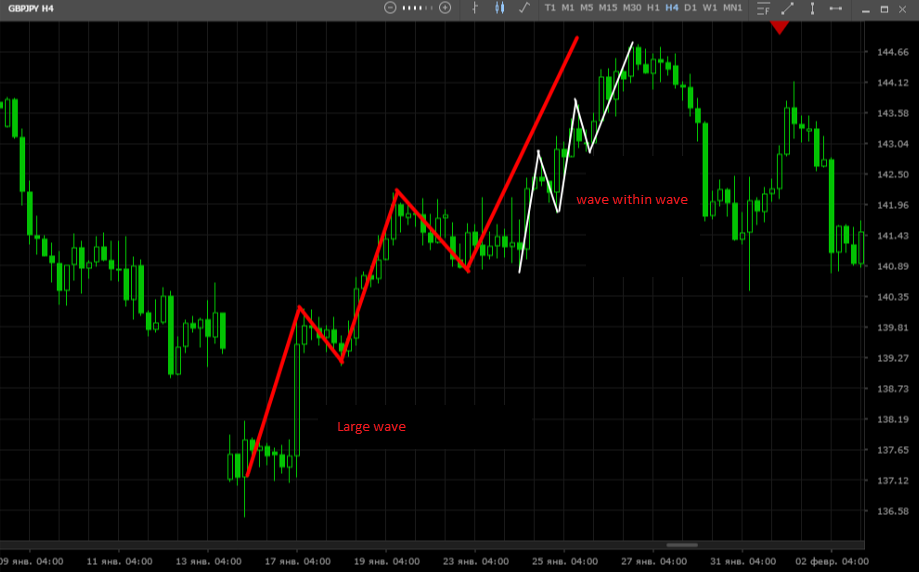
Regardless of the time period under consideration, it can be noted that each trend wave alternates with a correction one. But at the same time, each trend and correctional wave can be divided into eight waves, thus, within each movement there are local acting and opposing waves. The figure shows a finer wave in the composition of a large wave:
Wave analysis can be used on various timeframes. However, this type of analysis works most accurately on large time periods, and is less suitable for the youngest timeframes (M1, M15).
How to use wave theory in trading
The necessary information will give us a consideration of the price chart. On the chart, you need to determine the phase of the price movement and understand which of the eight waves is currently developing. The main disadvantage of wave analysis is the difficulty in determining the moment of a turn, since each wave consists of many movements. Therefore, it is necessary to build a strategy for working with wave analysis, building on the experience of the trader. There are several approaches to using wave analysis to find entry points and take profit:
For professional investors
This approach is used by players who have large capital, professional knowledge and experience. Large long-term investors tend to trade in a trend and begin to build positions during its inception. The first purchases are made already on the first wave, and the set of positions continues at the moment when the correctional waves end. Profit is fixed on the last rising wave, part of the positions can be realized after the peak, on the correctional (rising) wave. This technique allows you to get additional profit if the trend movement continues.
For novice traders
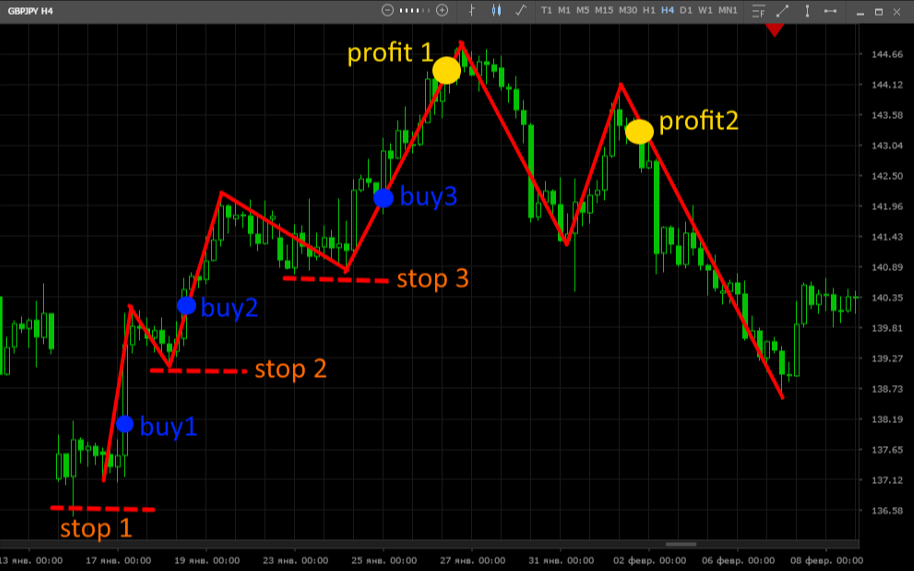
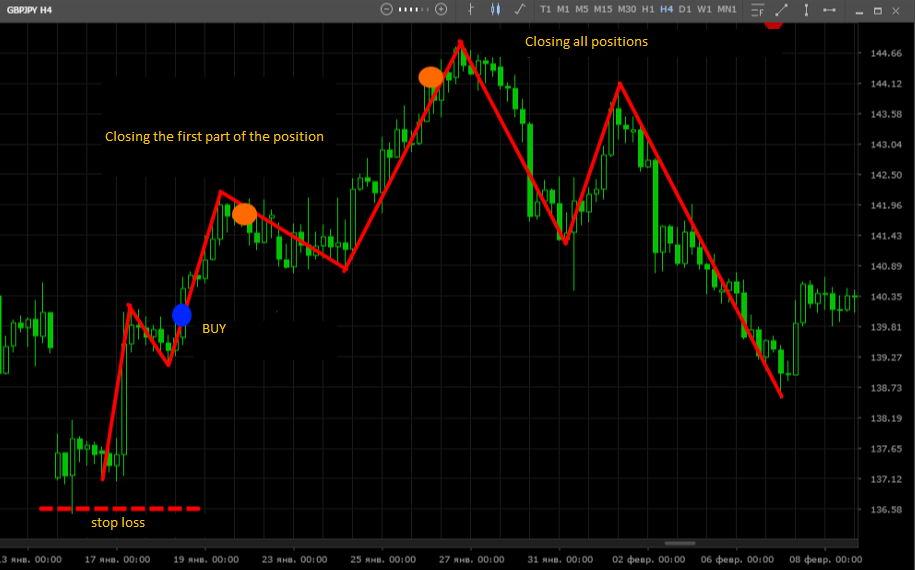
This method is well suited for beginners, as it allows you to minimize possible losses. During the first rising wave, one should refrain from active actions until the confirmation of a trend movement appears. This confirmation may be the end of the second (correctional) wave if the minimum price (at a turn) is higher than the level from which the first rising wave started, most likely this is a vertical trend.
Accordingly, immediately after a reversal and the formation of a third (ascending) wave, you can buy, and stop loss set at the level of the beginning of the first ascending wave. Part of the profit can be fixed immediately after the reversal at the end of the third (ascending) wave. The remaining positions can be closed on the fifth (ascending) wave above the level of formation of the fourth (correctional) wave. On the corrective movement (6, 7 and 8 waves), novice traders are not recommended to enter the market.
For experienced speculators
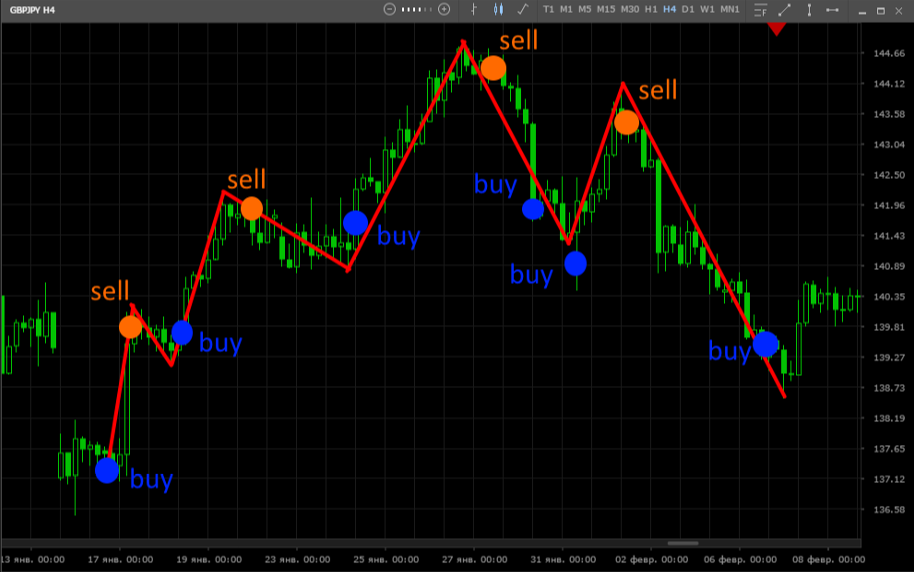
Private traders, who trade mainly within the day, and have some experience in this type of analysis, try to make a profit at each stage of wave development. That is, purchases are made as soon as there are signs of a reversal and the formation of a new wave, profit is fixed at the moment the impulse attenuates, and stops are set below the pivot point. Thus, during the whole trend on impulsive and corrective movements, you can earn more than just on impulsive movements (as in the case of investors), and more than on a partial capture of the trend (as in the case of novice traders).
How to determine pivot points
In addition to determining the wave itself and its place in a larger movement, it is necessary to understand what size this wave will have. It is known that after a strong impulse, a strong correction is most likely to follow, but how to determine what distance can the price go to the next turn? It is important to understand in time that the observed movement is a small sidewall before the continuation of the wave or a turn, the formation of a new wave.
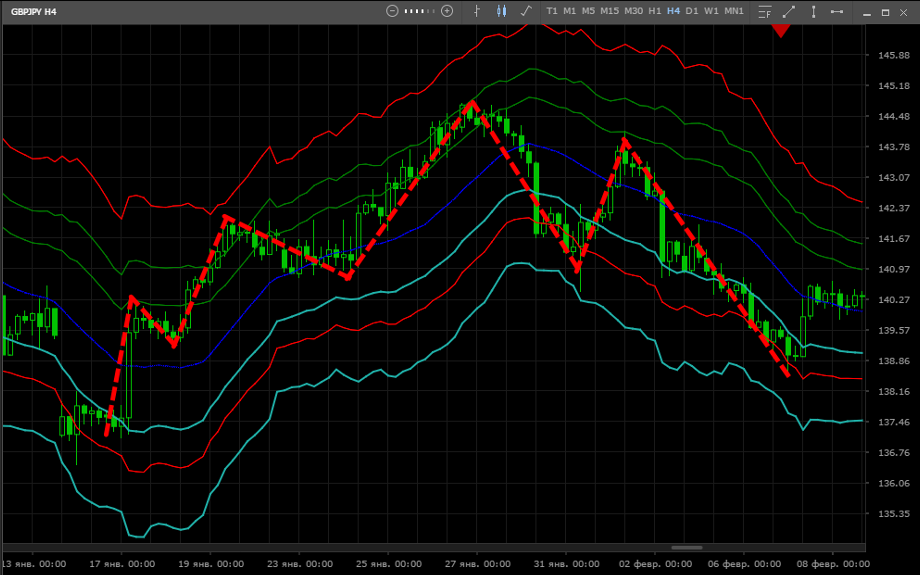
Traders who use wave analysis to predict, use additional tools that help determine the levels at which the price is likely to reverse. The most popular among the "wave" is a tool such as Fibonacci levels, Pivot Points (more about these tools is described in the relevant articles). Various technical indicators built into the trading platform are also used. To improve the quality of forecasts, a combination of indicators and additional technical analysis tools are often used. In the picture below - the Bands Fibo True indicator, which shows potential reversal levels:
Conclusion
Wave analysis is a powerful tool and has been used by traders of various levels for decades. However, this type of analysis can hardly be called self-sufficient, as a rule, it demonstrates maximum efficiency in combination with additional methods. In addition, we should not forget that the effectiveness of the wave strongly depends on the traded asset, not all assets wave analysis works equally well. Much depends on the experience of the trader, since the recognition of the stages of the wave is in fact not as simple an activity as it might seem when studying the theory.