
 Russian
  中文
中文  العربي
  Bahasa Indonesia
 Indicator Bollinger Bands
We are glad to provide you the Bollinger Bands indicator which except price force shows also overbuy and oversell for a certain period of time. It is placed in the section Indicators - Trend
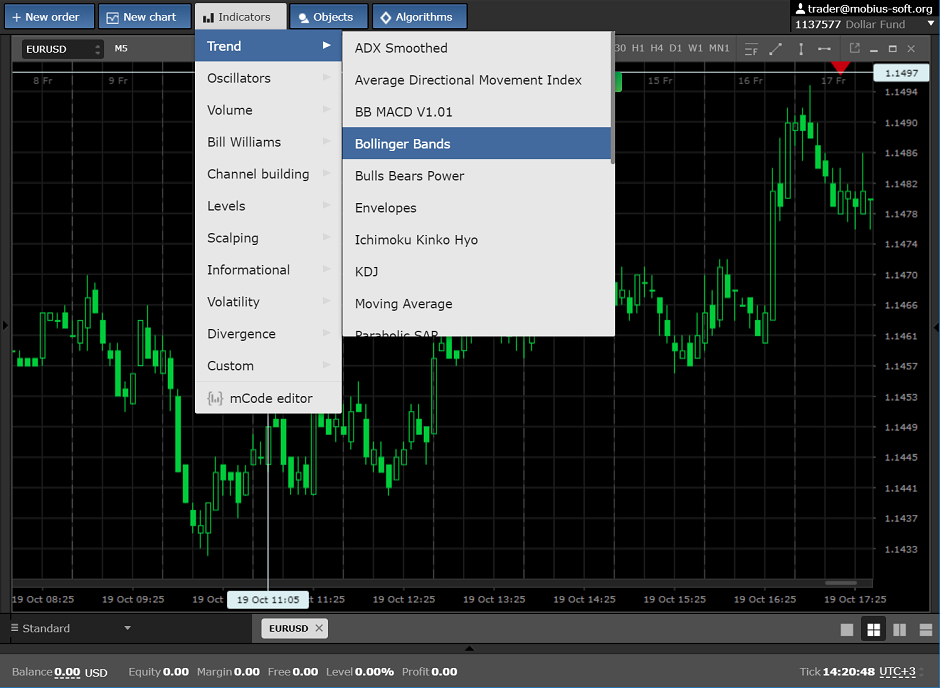
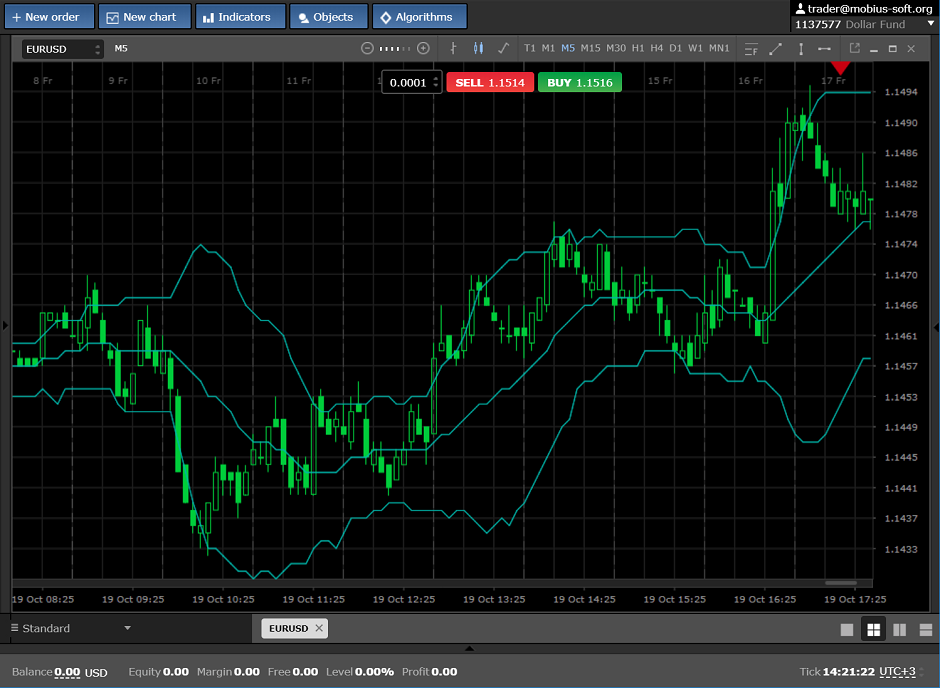
It looks as following:
Settings of the indicator
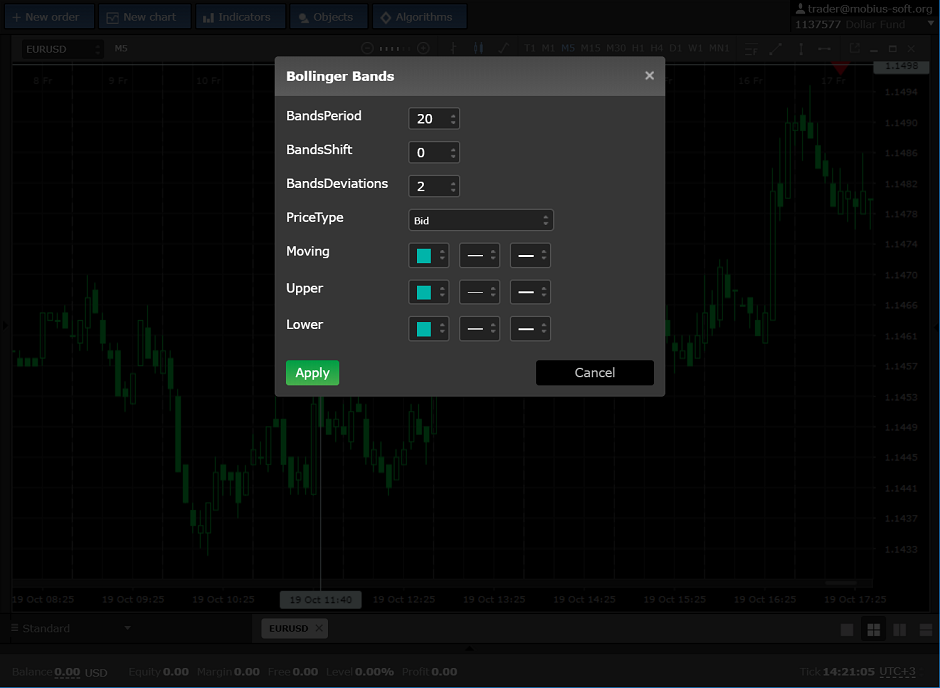
Period
Shift
Deviations
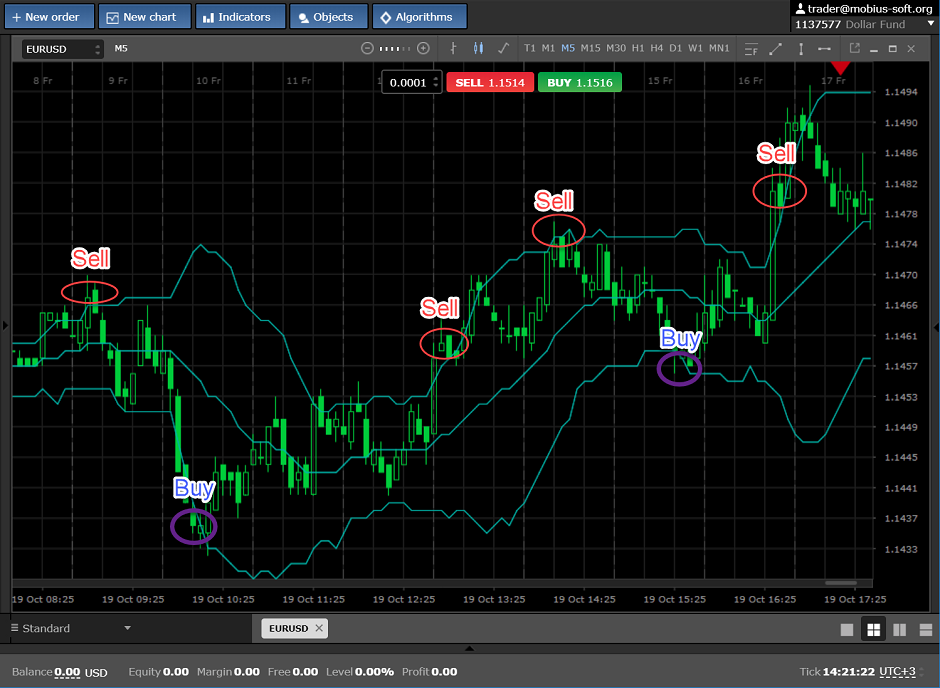
It is better to trade on this indicator like that:
To sell when the price touches the upper line of the indicator
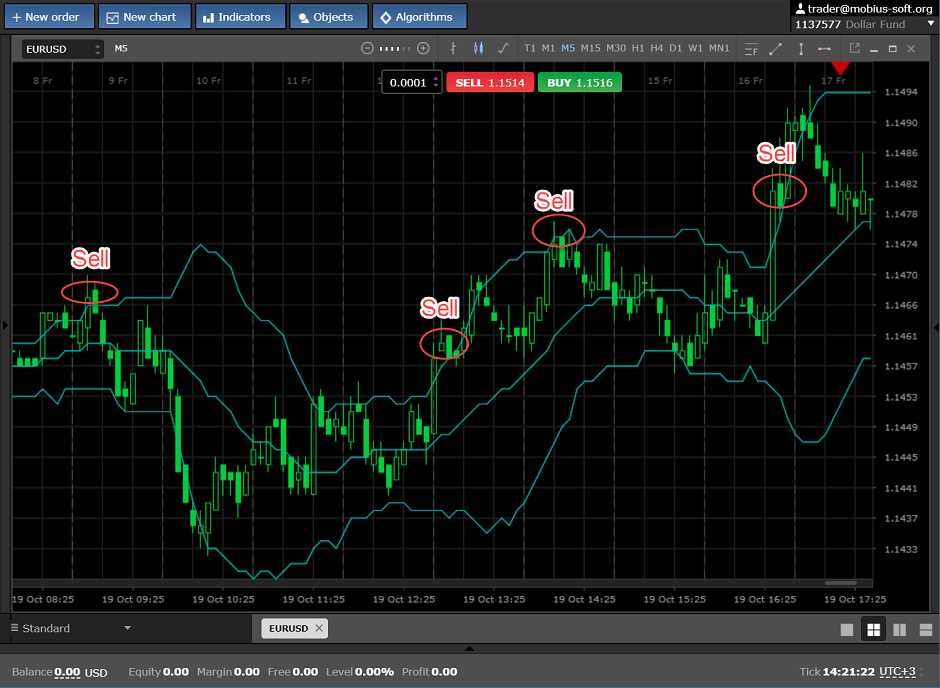
and buy when the price touched the lower Bollinger band, as shown at the pic below.
This indicator will be an excellent assistant, both to beginners, and professionals. We wish you high profit.