
 Russian
  中文
中文  العربي
  Bahasa Indonesia
 Indicator NB-channel
One more very popular indicator is the NB-channel which task is to draw Barishpolts channels on the chosen tool.
It is placed in the section Indicators "Channel building"
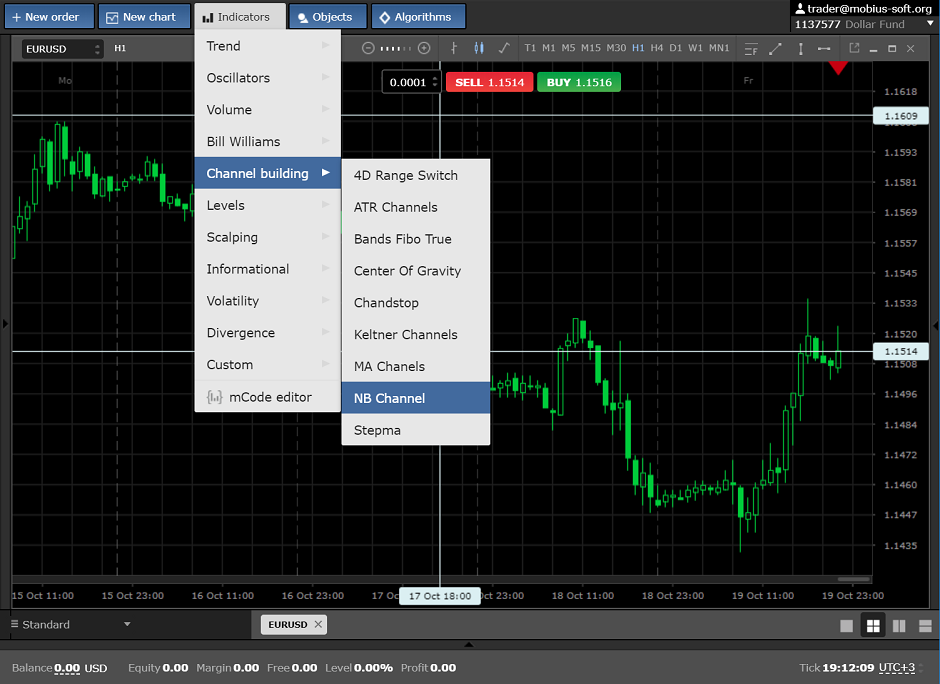
It looks like that at the chart:
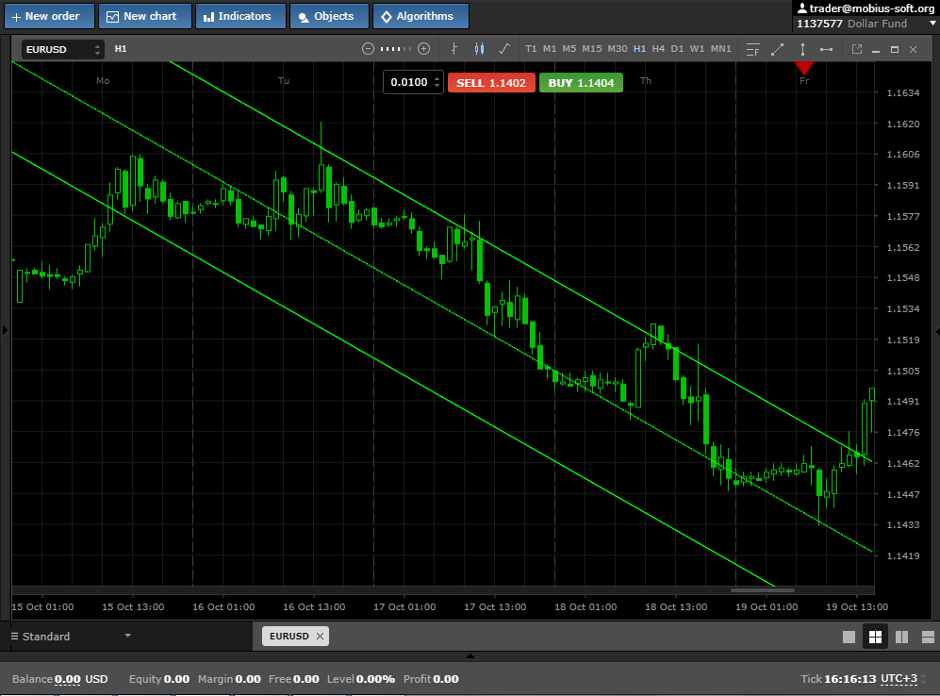
In case of building of the indicator NB-channel finds two next fractals at the history and draws a line between them. On the counter party the parallel line is built on a fractal extremum. The line between borders of the channel – middle one.
Settings of the indicator:
AllBars – how many candles or bars which the indicator considers for finding of price minima and maxima.
BarsForFract – the number of the bars necessary for finding of a fractal. If you leave 0, then the indicator under each time period will deliver the values:
12 on a time frame M1;
48 on a time frame M5;
24 on a time frame M15;
24 on a time frame M30;
12 on a time frame H1;
15 on a time frame H4;
10 on a time frame D1;
6 on a time frame W1;
This indicator will be perfectl as for trade on breakdown and release from the channel, and for trade in the channel, as shown at the pic. below.
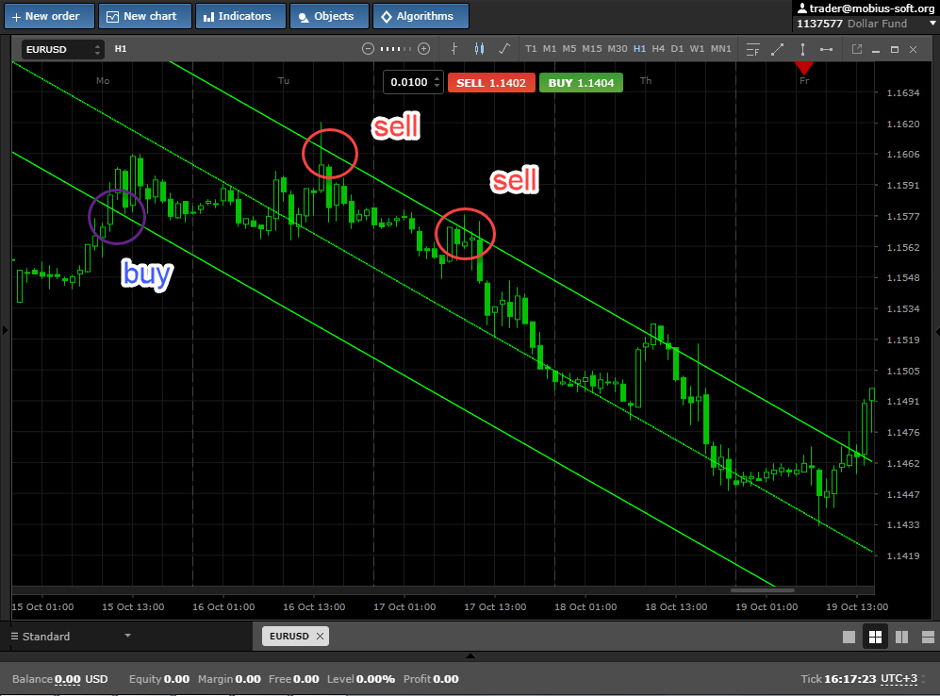
As we see if to trade on a trend in the channel, it is possible to receive many good points of entry. On smaller time periods it is possible to use oscillators which show levels of overbuy and oversell with the NB-channel indicator. It will reduce the number of unprofitable transactions. We wish you high profit.