
 Russian
  中文
中文  العربي
  Bahasa Indonesia
 Indicator Chandstop
We present to your attention the Chandstop indicator which task is to show on the price chart when it is better to buy and when to sell.
It is placed in section Indicators – Channel building – "Chandstop"
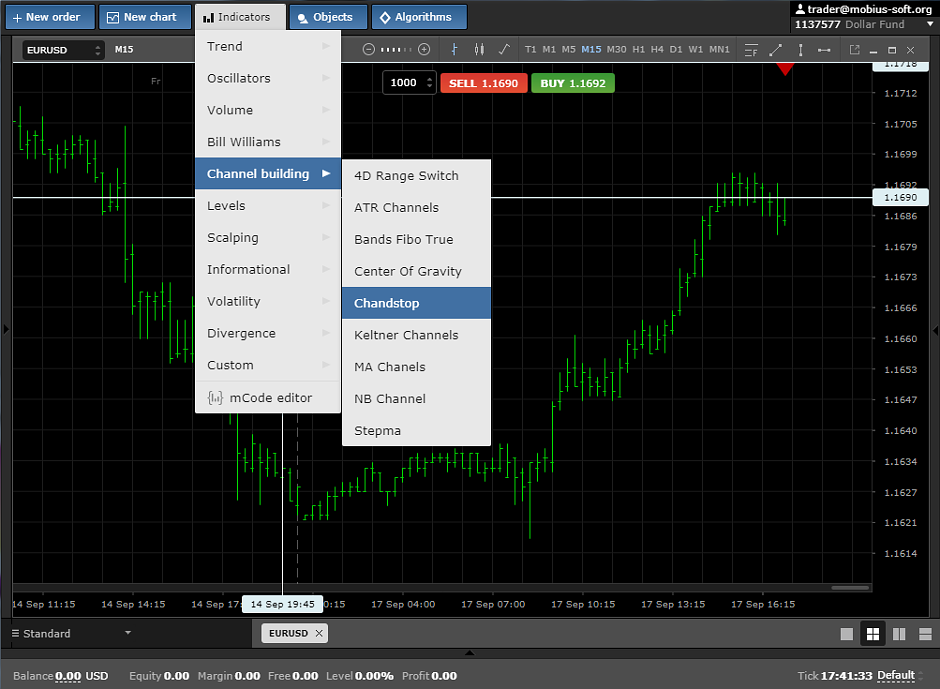
And it looks at chart like that:
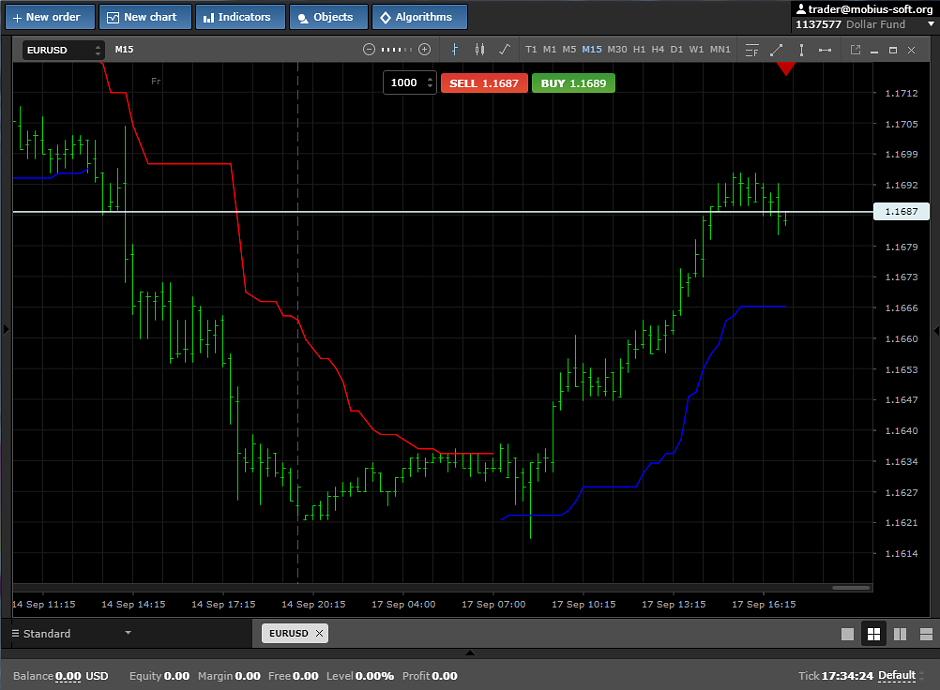
It is possible to trade on this indicator in the following way:
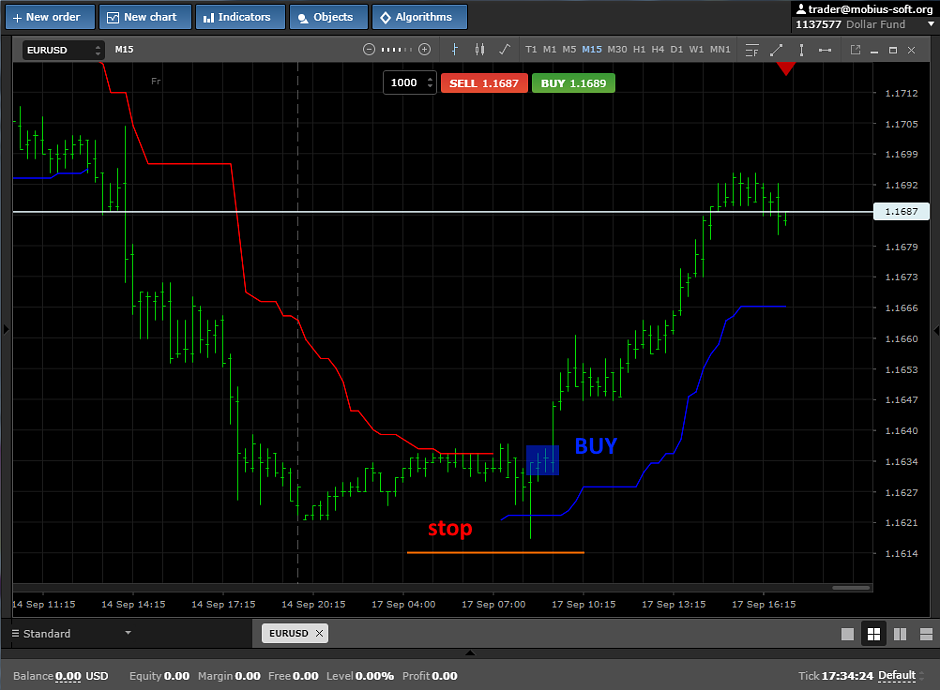
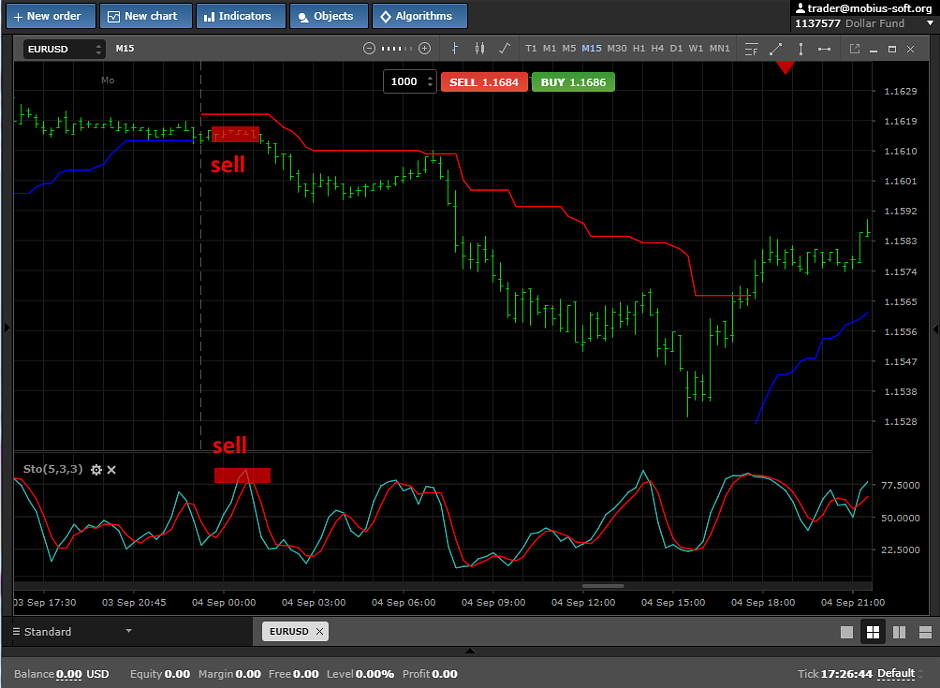
To sell if the price is below the red line and to buy it if the price is higher than the blue line, as it is shown at the pic. below. Stop loss should be placed under the last local minimum but if it is very far, a signal one entrance is better to miss.
It is better to use this indicator in a combination with oscillators which show levels of a rebought and oversold to increase the number of profitable transactions.
Good luck!