
 Russian
  中文
中文  العربي
  Bahasa Indonesia
 Indicator Money Flow Index (MFI)
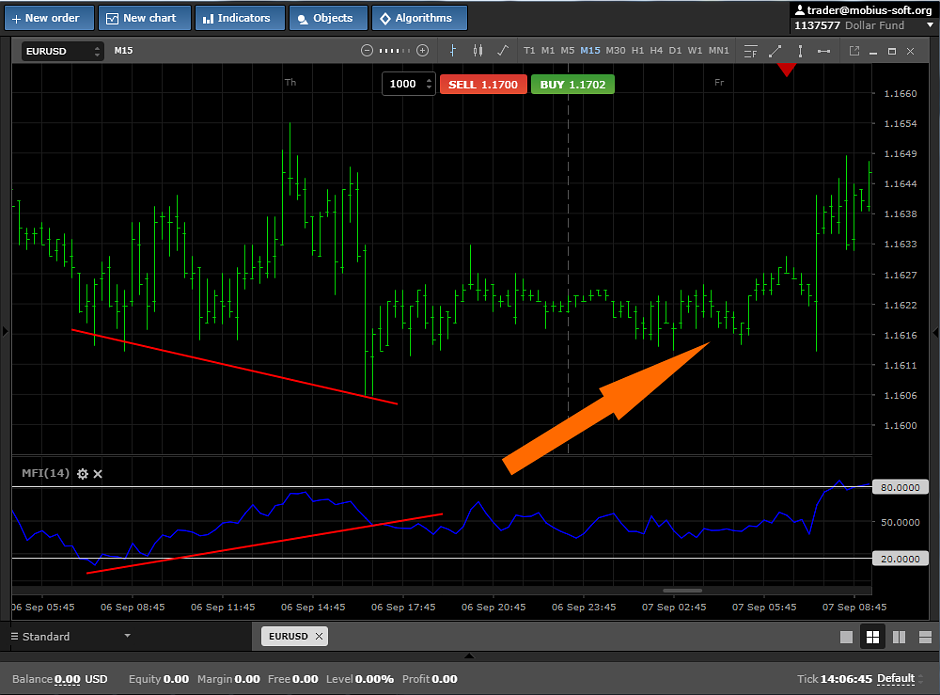
One more very popular indicator is Money Flow Index (MFI) which is the advanced version of RSI as in its principle lies the amounts, and it capable to show in what moment in the traded tool is invested equity thereby it forces the price to move. It is placed in the section Indicators -Volume
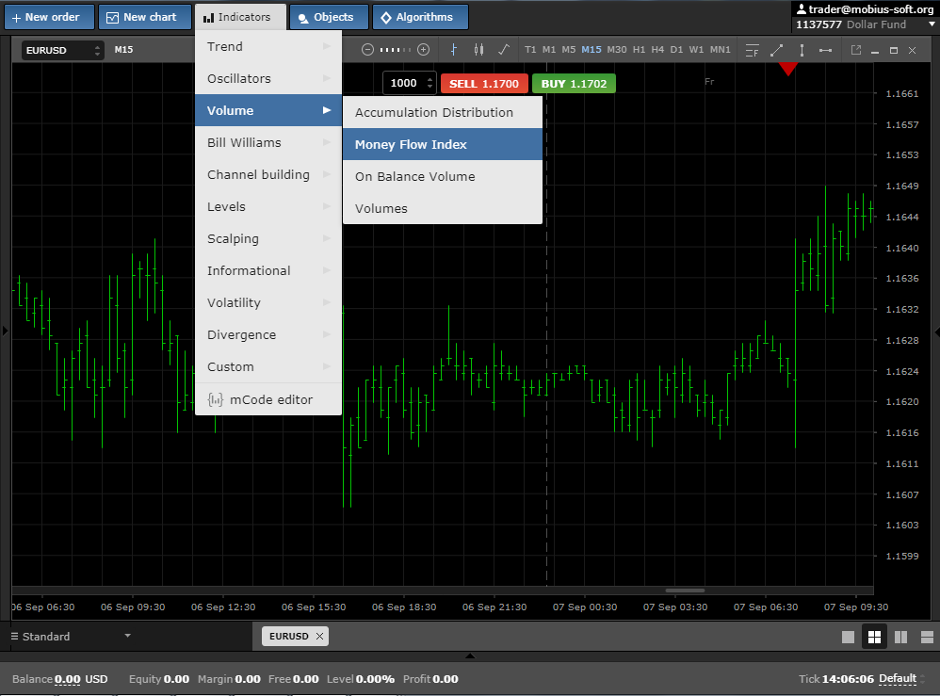
and it looks at the chart as following:
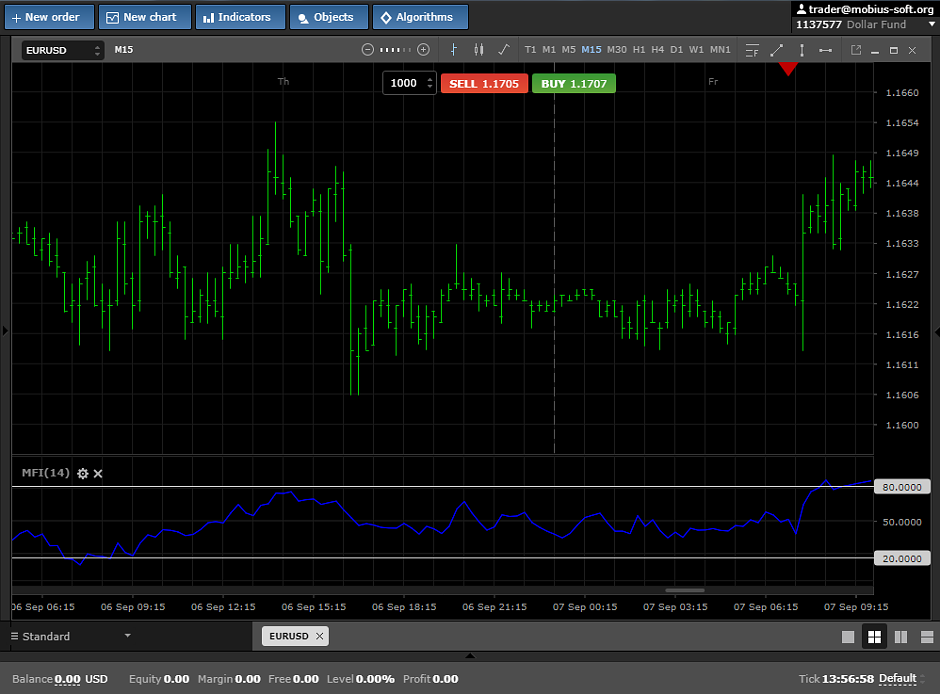
The MFI indicator compares all financial investments in the traded tool that gives us information on trend force which the indicator in its turn interprets in the range from 1 to 100 as shown at the pic above.
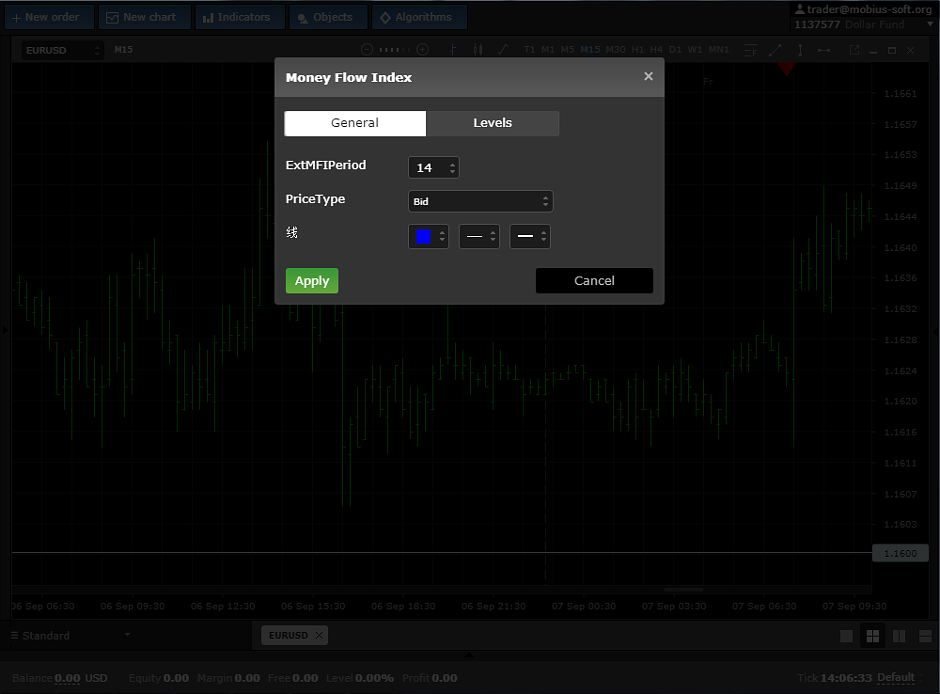
In settings of the MFI indicator it is possible to change the period, width and color of the line for the best visual perception and understanding that occurs at the chart at present.
It is possible to trade on this indicator in the following way:
To expose the level of overbuy - 80 and an oversell – 20. If the line of the indicator reaches a mark 80 it is necessary to buy and if mark 20 – to sell, as shown in at the pic.
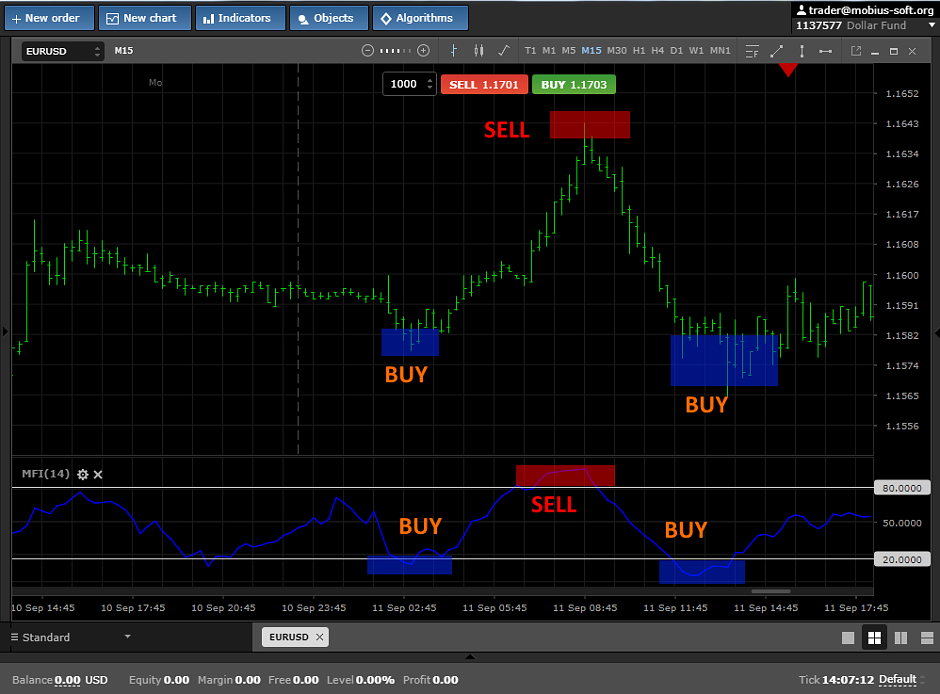
Also on this indicator it is possible to look for divergence, a difference between value of the line of the indicator and the price chart.
It is better to use the MFI indicator together with the trend indicator or oscillator. We wish you good profit.