
 Russian
  中文
中文  العربي
  Bahasa Indonesia
 Center Of Gravity Indicator
Another very popular indicator is the Center of Gravity indicator.
It is located in the channel building indicator section.
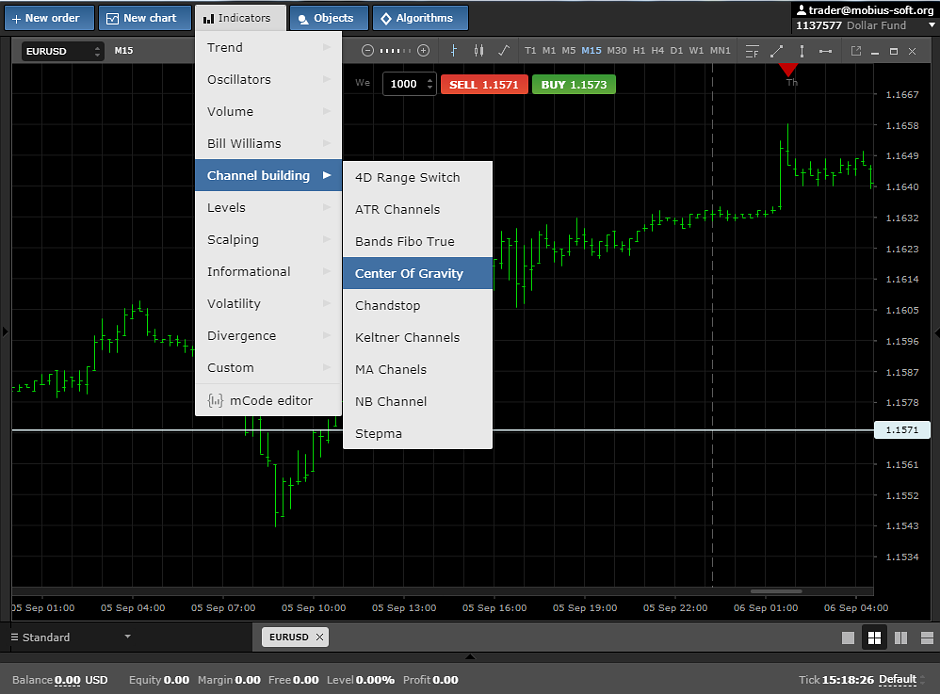
and it looks like this on the chart:
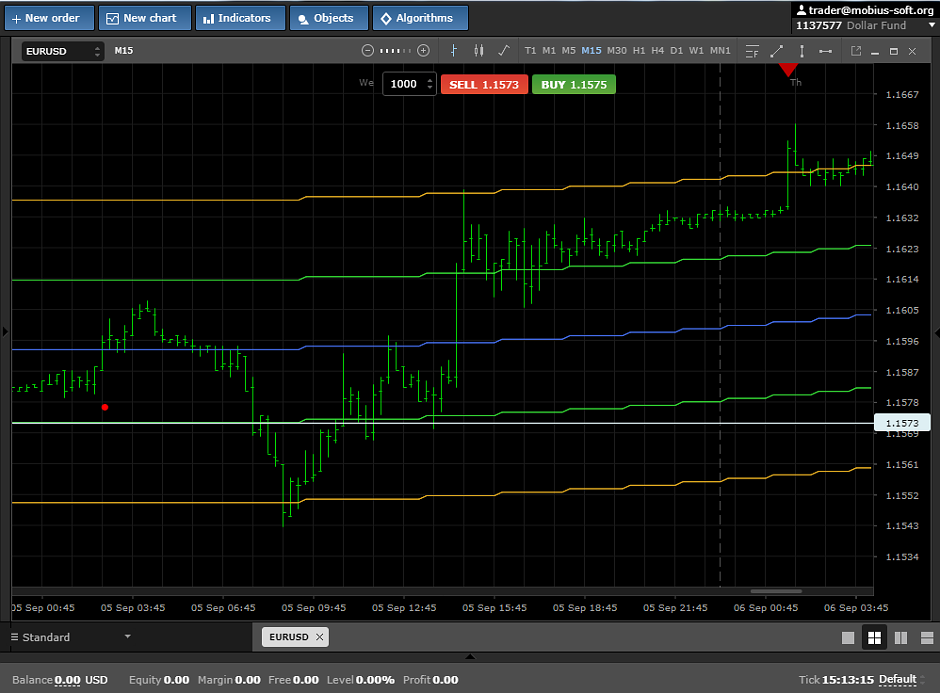
The Center of Gravity indicator displays channels on the price chart of a currency pair which width depends on the level of volatility.
The blue line is the midline of the channel;
Green lines are the inner borders of the channel;
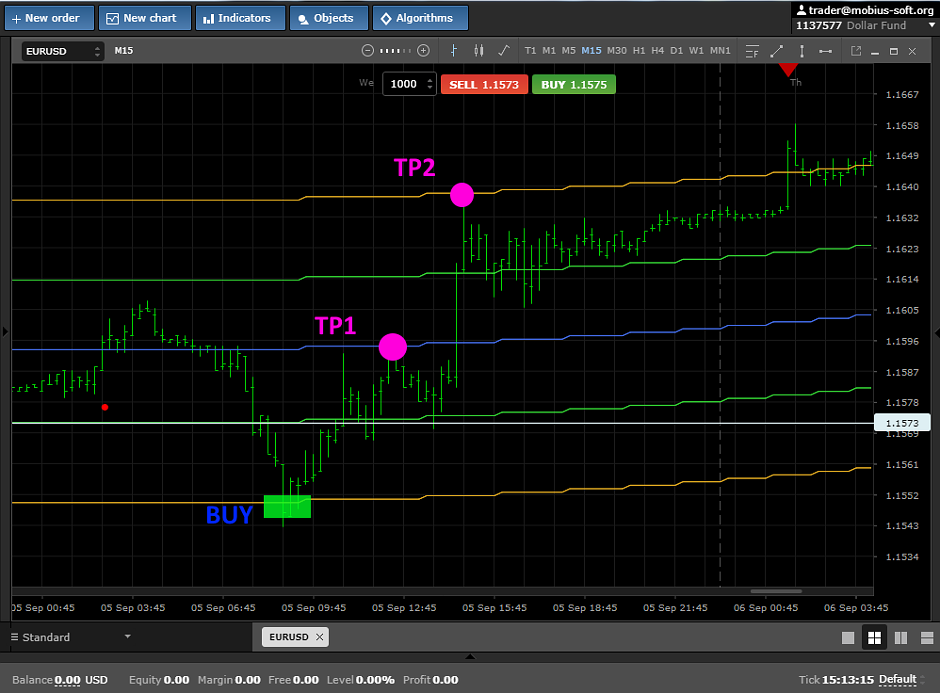
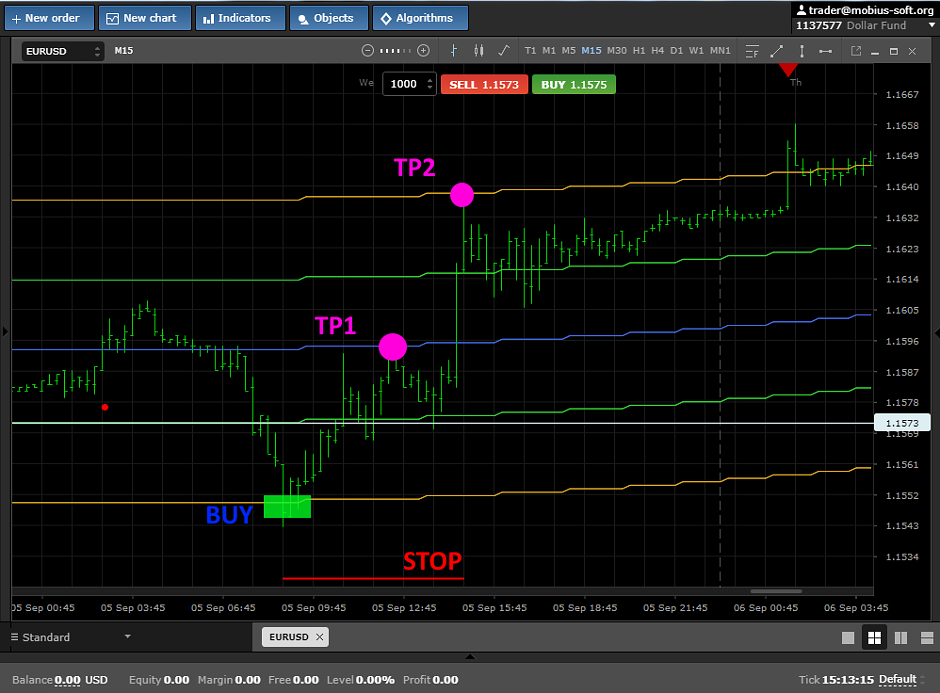
The yellow lines are the outer borders of the channel. And the less volatility in the market, the smaller the distance between these boundaries. You can trade on this indicator by opening 2 orders on the channel border with a profit of 1 order on the middle line of the channel and a profit of 2 orders on the opposite border of the channel, as shown in the figure below
Stop loss must be set at a distance equal to the gap between the green and yellow lines.
The Center of Gravity indicator will be an excellent assistant or even a trading system for beginners. To filter out false signals, you can use indicators showing overbought and oversold levels. We wish you profits.