Indicator Step RSI V2
In this overview we would like to tell about the StepRSI v2 indicator which is the modified version of the RSI indicator. It is placed in the section Indicators - Trend
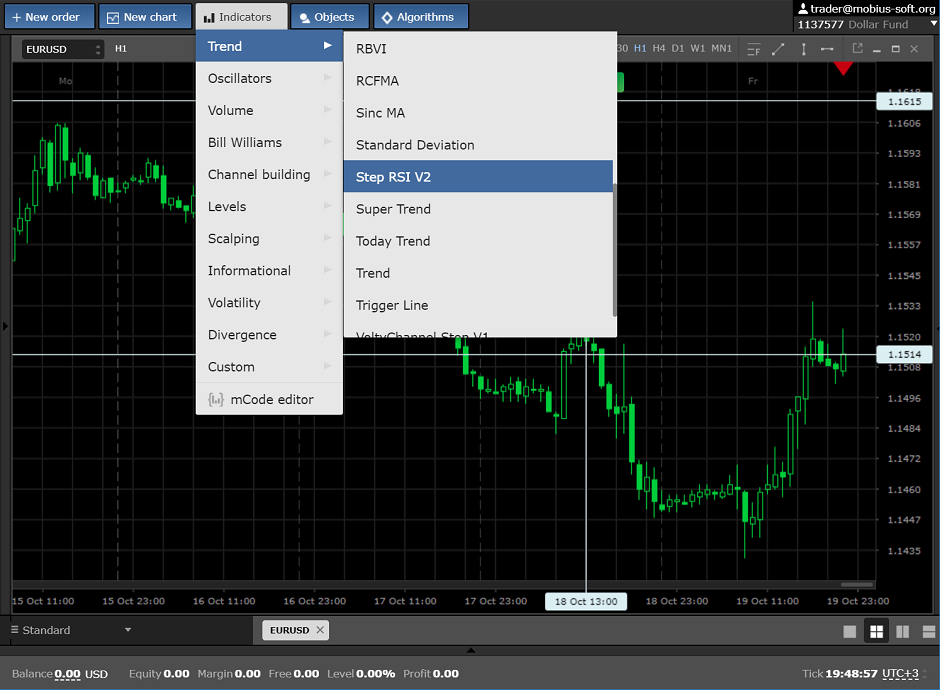
it looks as following:
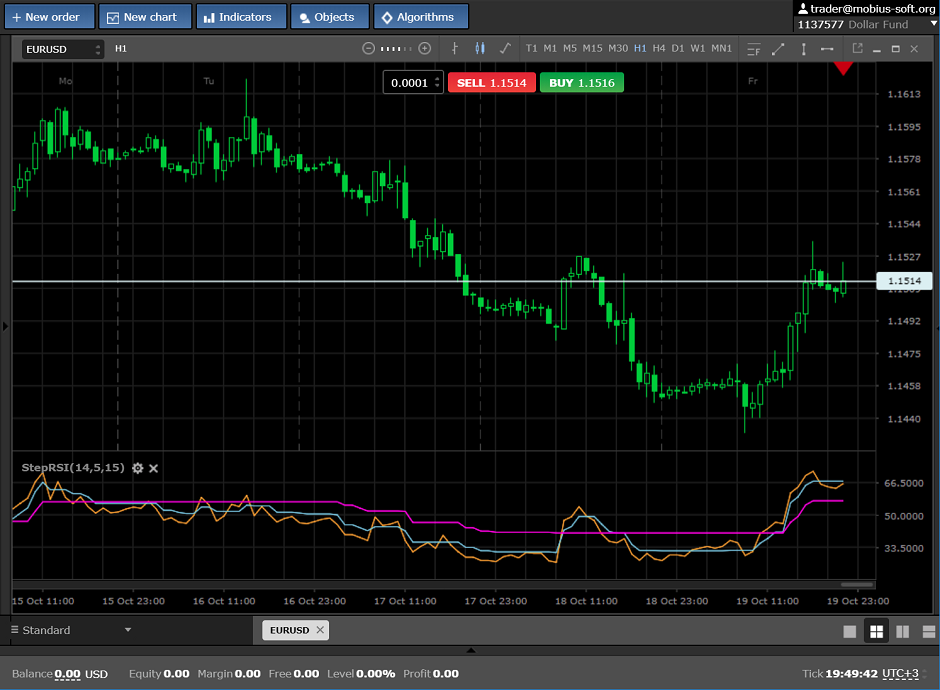
Settings of the indicator:
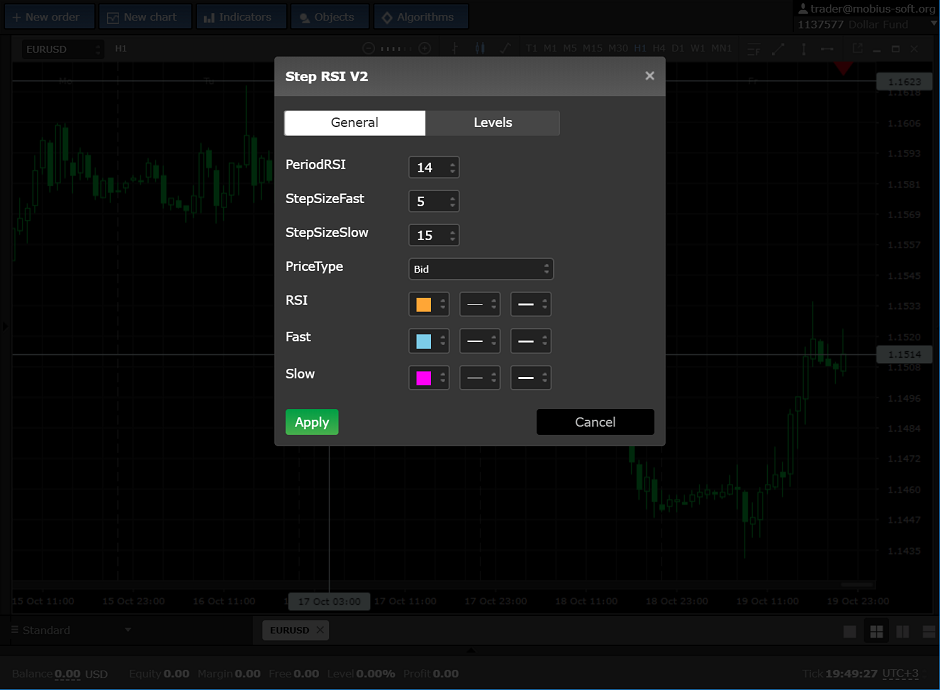
Unlike the standard RSI indicator, in our indicator are added two more lines and the more value to specify the smoother they will be.
In the left part of the picture it is possible to see values of smoothing of lines more than in the right part.
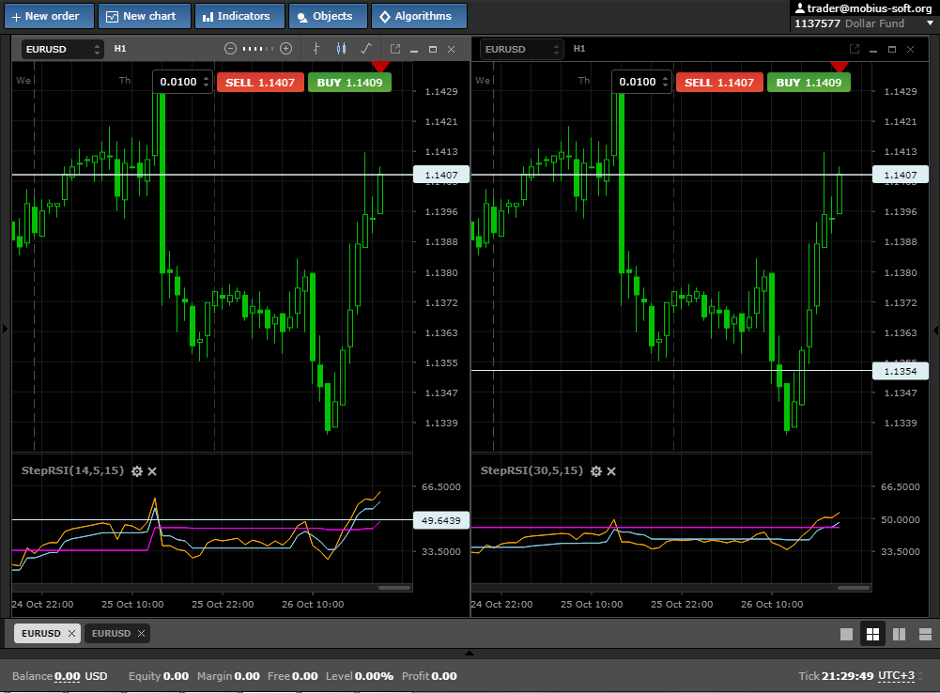
And if to expose zero, then these two lines will merge with the main yellow line. In practice StepRSI v2 can be used as following:
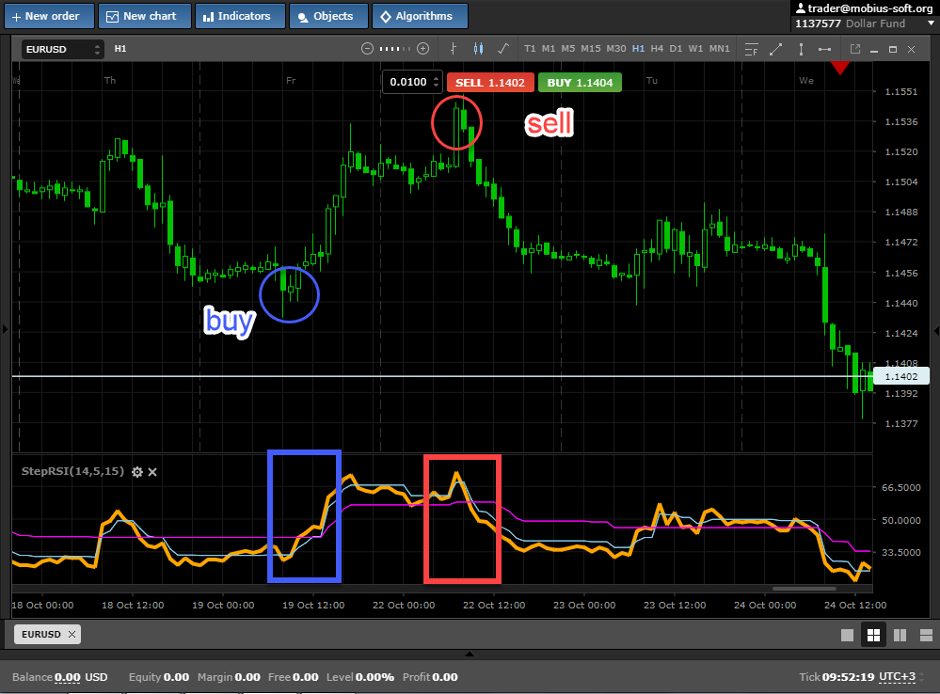
To buy when the main yellow line crosses from below up the pink and blue line and to sell when yellow crosses them from top to down, as shown in the drawing below.
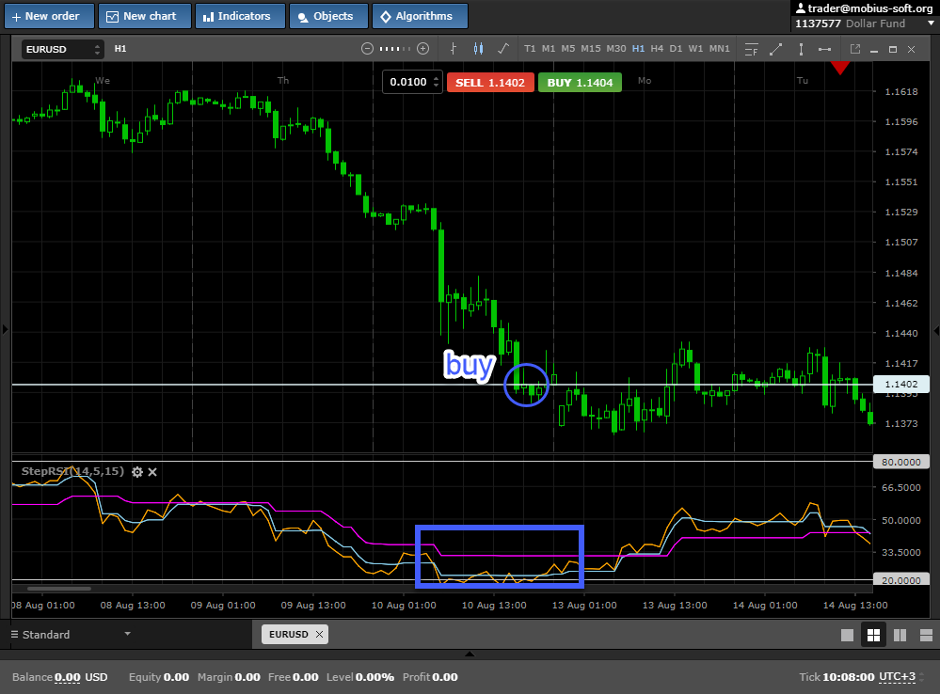
Also in this indicator it is possible to expose levels 20 and 80 and to trade for sell when three lines reach level 80 and to buy when they are near a mark 20.
We wish you high profit.

 Russian
  中文
中文  العربي
  Bahasa Indonesia