Indicator Volant
We present to your attention the indicator Chaikin Oscillator or Volant which operation is based on measurement of pressure force of all sellers and buyers.
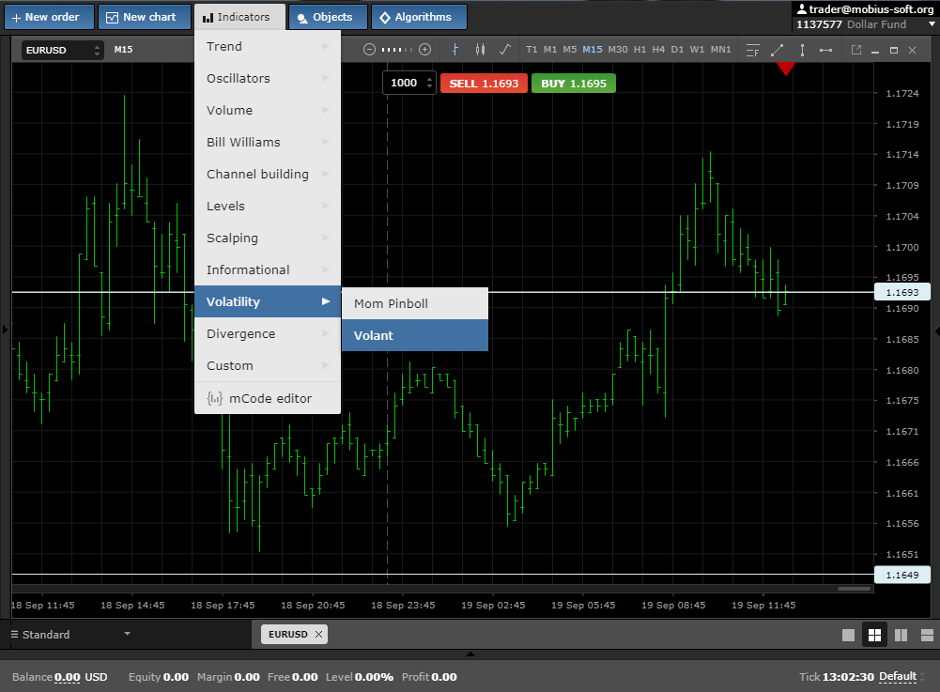
It is placed in the section Indicators "Volatility"

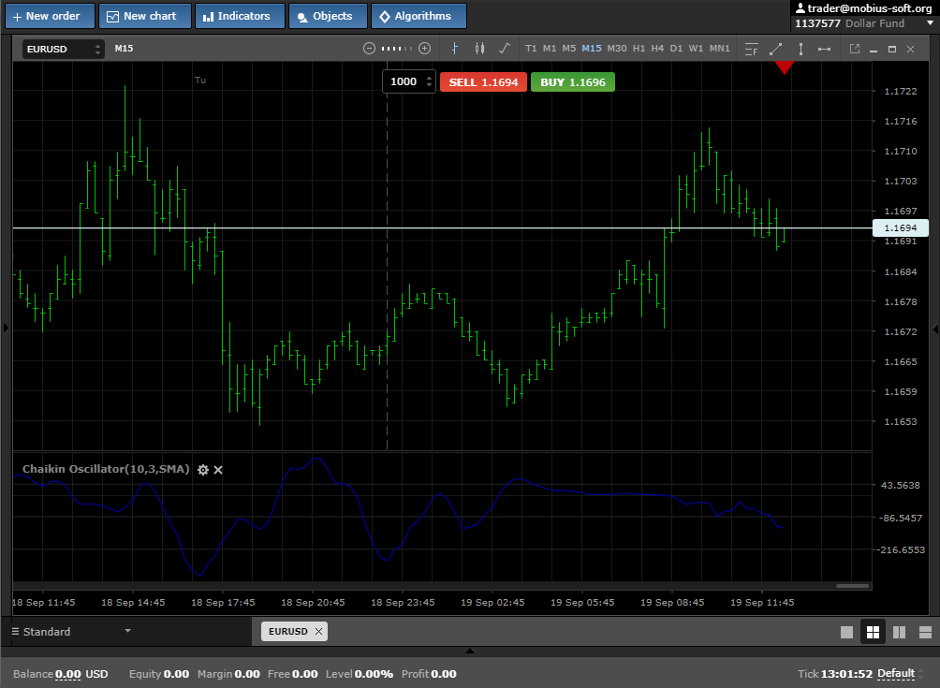
It looks at the chart as following:

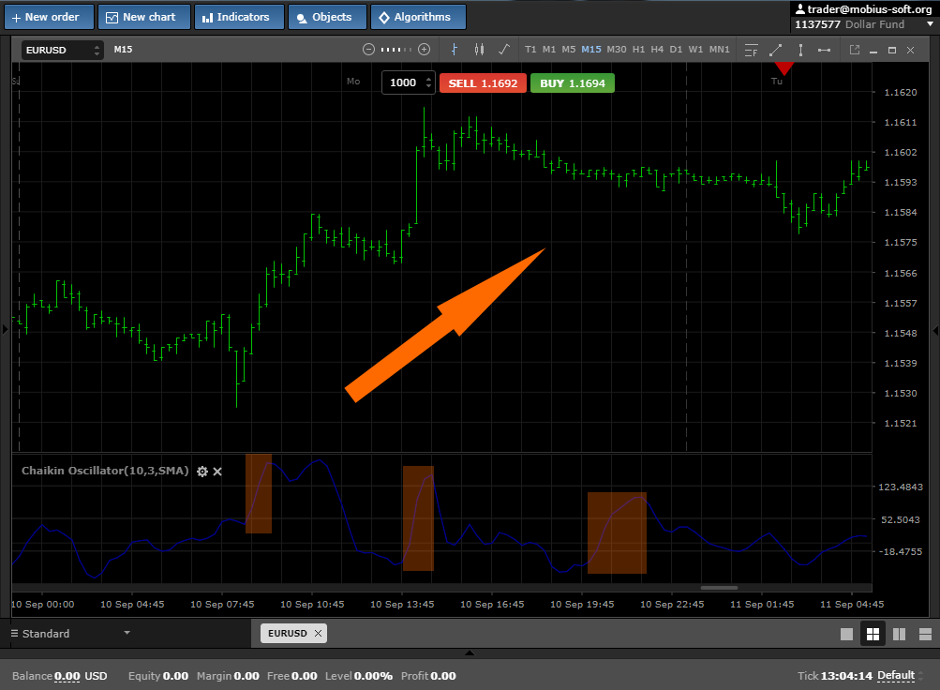
The method of calculation of indications is based on a simple "Meeting-leaving of MA" or MACD. If the line of the indicator aims down in case of any movement of the price, then it means sales or distribution of funds from investors. And if the line goes up, investors buy or accumulate line items as shown at the pic. below:

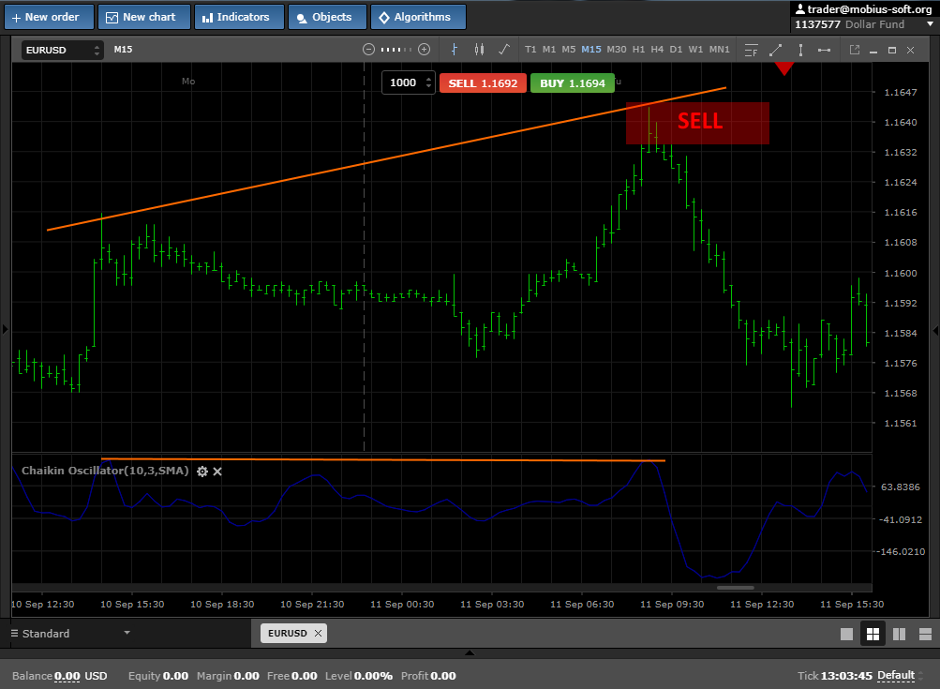
Also this indicator shows divergence.

This indicator will be suitable for understanding of the market, and also additional earnings from identifications of divergence. We wish you high profit

 Russian
  中文
中文  العربي
  Bahasa Indonesia