
 Russian
  中文
中文  العربي
  Bahasa Indonesia
 Indicator Volumes
We are glad to provide you the indicator called Volumes which task is to show the number of perfect transactions for a certain timepoint.
It is placed in the section Indicators-Volume-Volumes
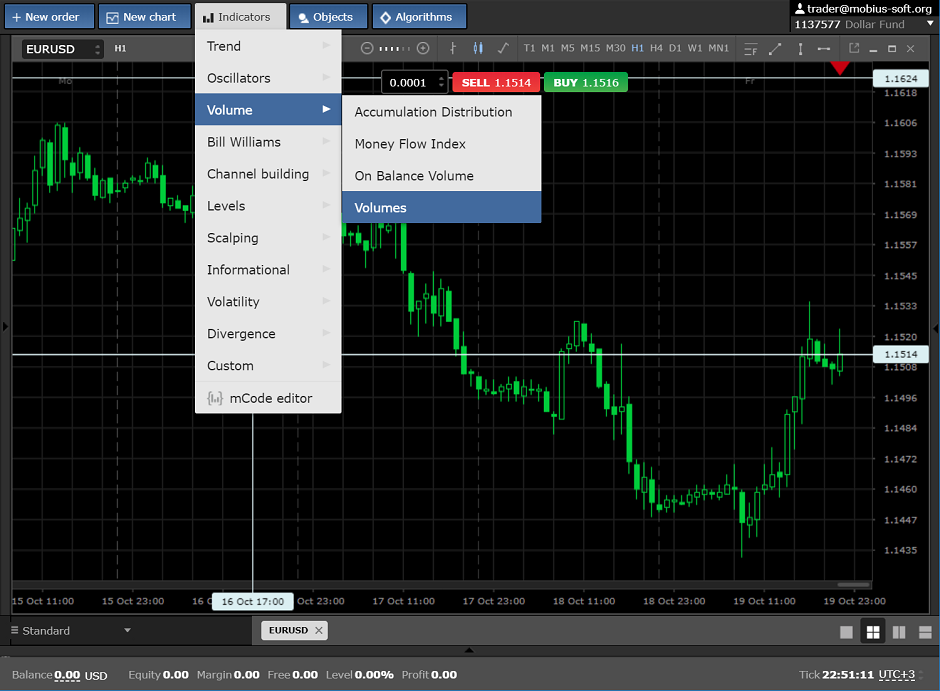
It looks at chart as the histogram from columns:
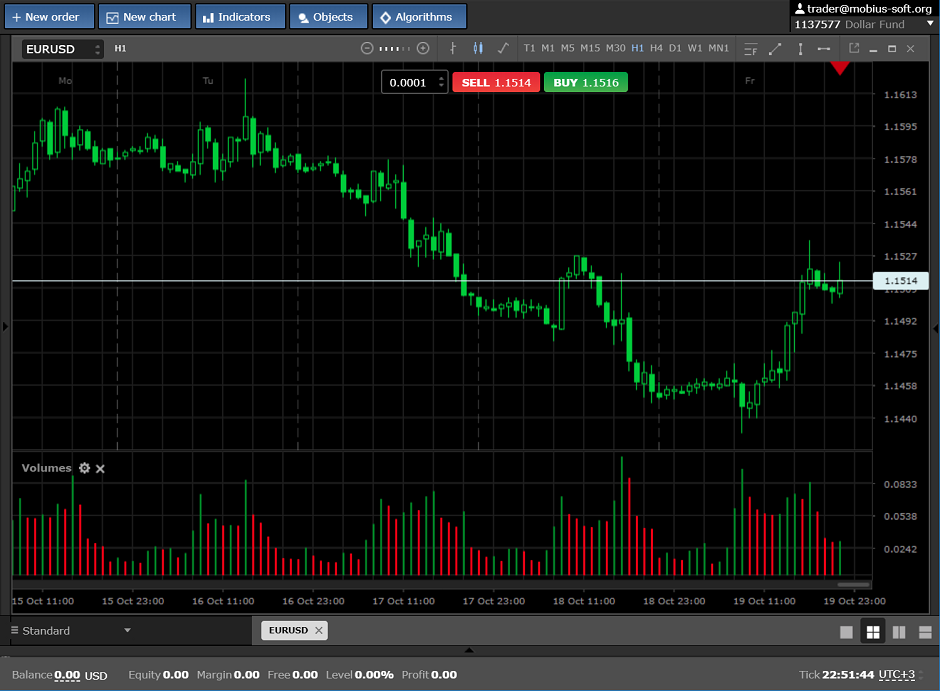
Height of each column depends on the number of the transactions made for this period of time. The more tics Were in a candle, the more is volume and height in the histogram.
Also, by its visual type it is possible to notice that columns of the indicator are represented in red and green color. If the column is red - it means that its values below, than at the previous column and if a column green – values are above.
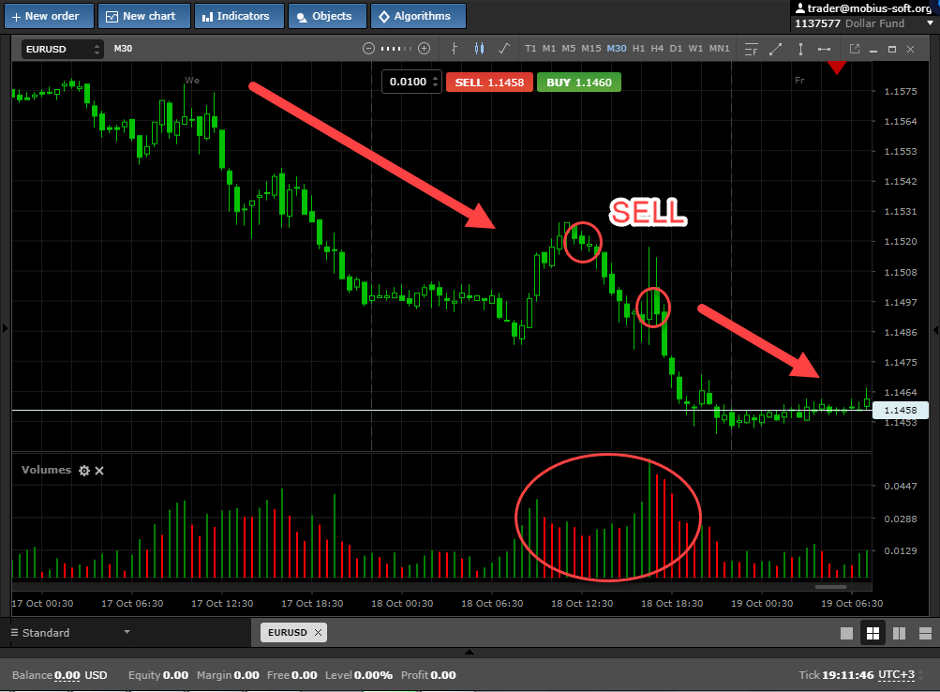
It is possible to use the indicator Volumes as follows:
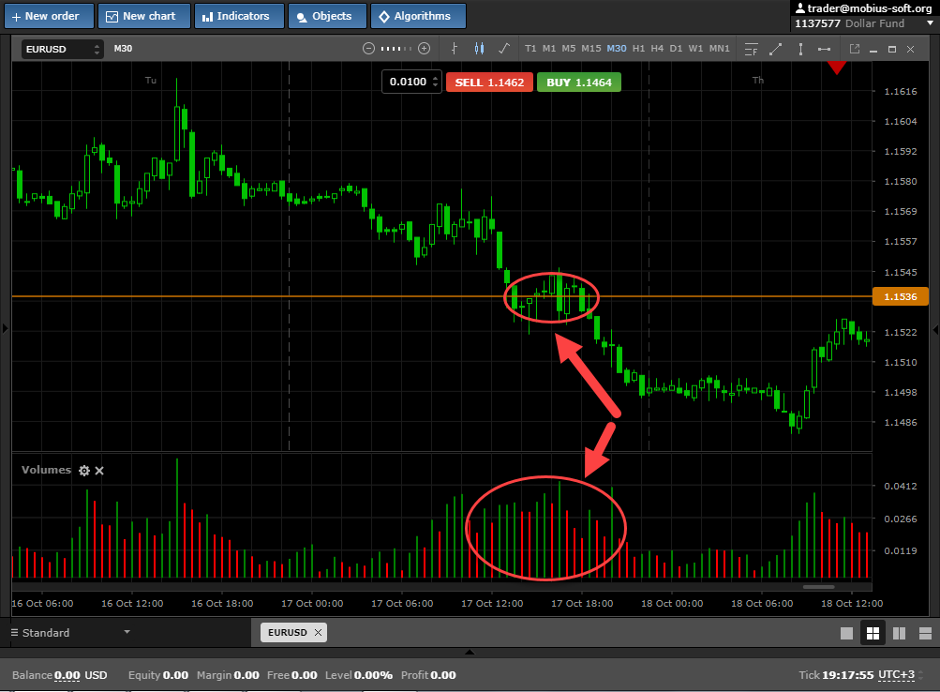
If tick volume grows behind the trend movement, then it means that movement will continue and it is necessary to enter only on a trend and if the trend goes down and at the same time the tick volume of the indicator begins to fall, then it says that there will be a price turn soon.
Also, if breakdown of important level happens from increase of the histogram of the indicator, then it is a confirmatory signal of the validity of breakdown.
It is better to use the Volumes indicator in addition to other trend indicators and oscillators. We wish you high profit.